
Last analysis expected a little upwards movement as likely for the main wave count, and upwards movement for the alternate. Price has moved higher but remains range bound.
We need to see price break above 1,654.19 or below 1,560.33 to have clarity this week. At this stage the main wave count is only slightly more likely than the alternate.
Click on the charts below to enlarge.
Main Wave Count.
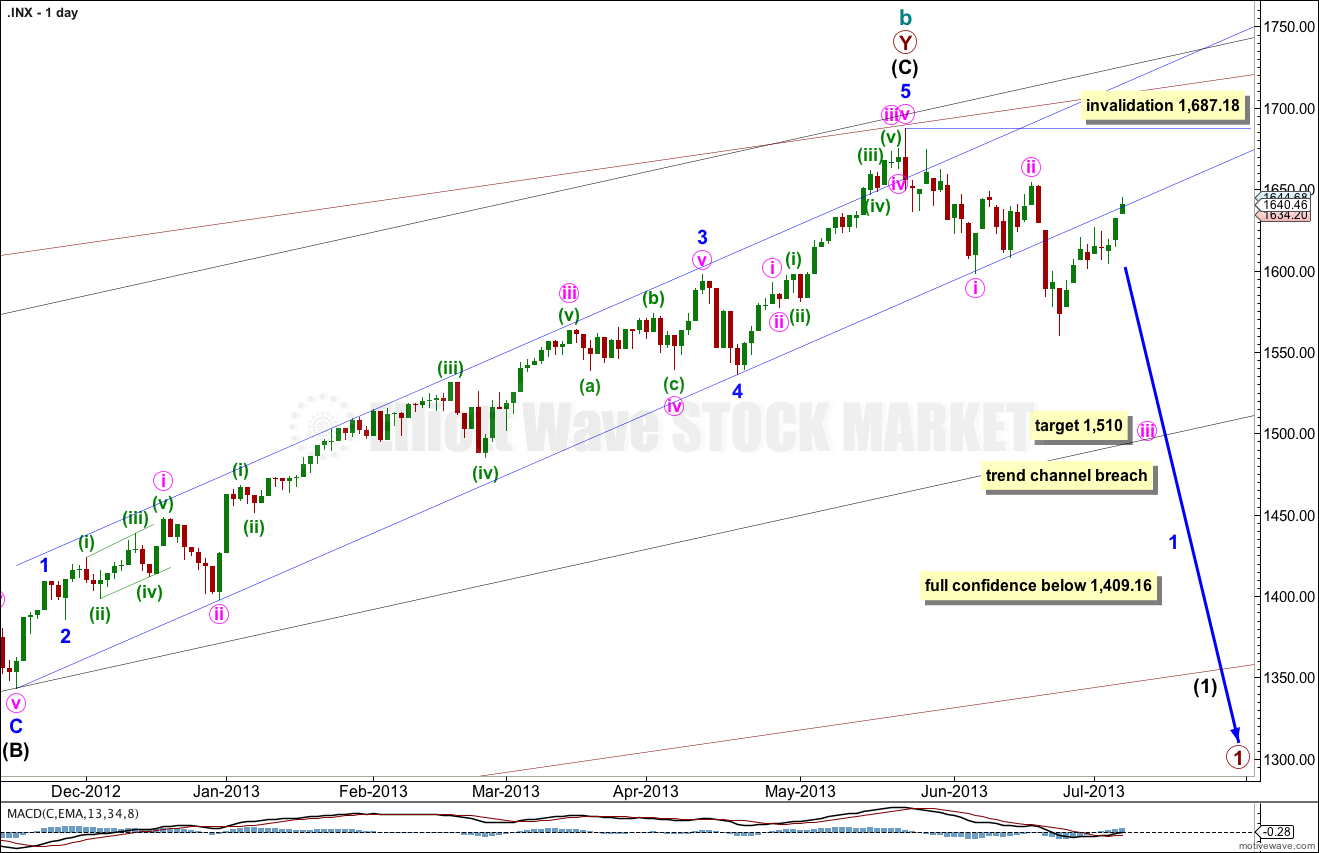
The widest maroon channel is copied over from the monthly chart and contains all of cycle wave b. It may be that price found final resistance at the upper edge of this channel.
The black channel in the middle is drawn about the zigzag of primary wave Y. Draw the first trend line from the start of primary wave Y to the end of intermediate wave (B). Place a parallel copy upon the extreme within intermediate wave (A). The upper edge of this channel also may be where price found resistance and where intermediate wave (C) ended.
The smallest blue channel is the most conservative best fit I can see for intermediate wave (C). It is very clearly breached by downwards movement. Today price broke through resistance at the lower edge of this channel.
What would give me confidence in this trend change is a clear breach of the black intermediate degree channel. When that is breached I will calculate long term downwards targets for you.
There is no classic technical divergence between price and MACD on the daily or weekly charts. This is possible, but unusual for the S&P 500. This must reduce the probability of this wave count. We must seriously consider the alternate.
There are no Fibonacci ratios between minor waves 1, 3 and 5 within intermediate wave (C). There is no Fibonacci ratio between intermediate waves (A) and (C). This lack of Fibonacci ratios slightly reduces the probability of this main wave count.
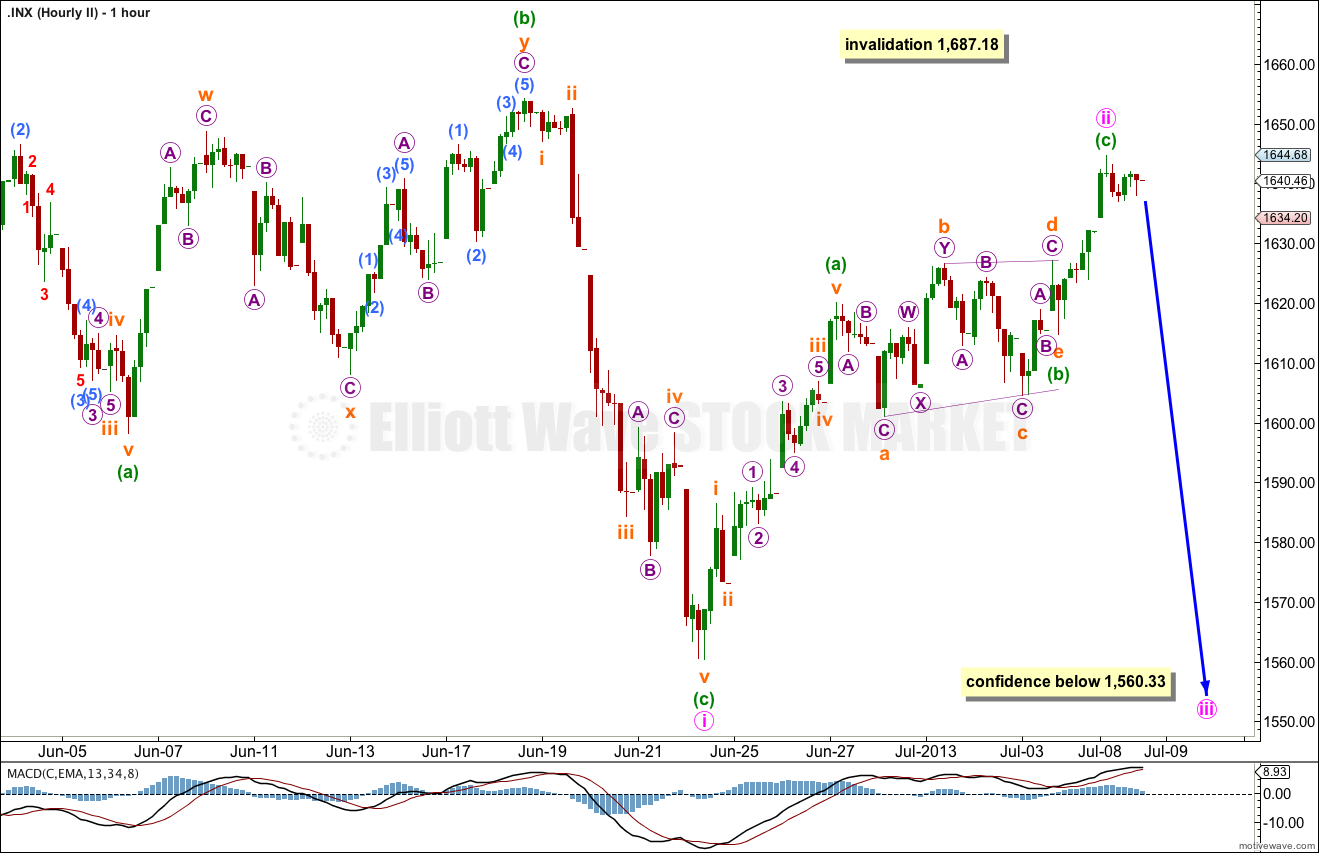
Today, I have two hourly charts for you for this main wave count. The first hourly chart follows on directly from last analysis and looks at minor wave 1 as unfolding as an impulse. Within the impulse there are two overlapping first and second waves. This is extremely common so has the highest probability.
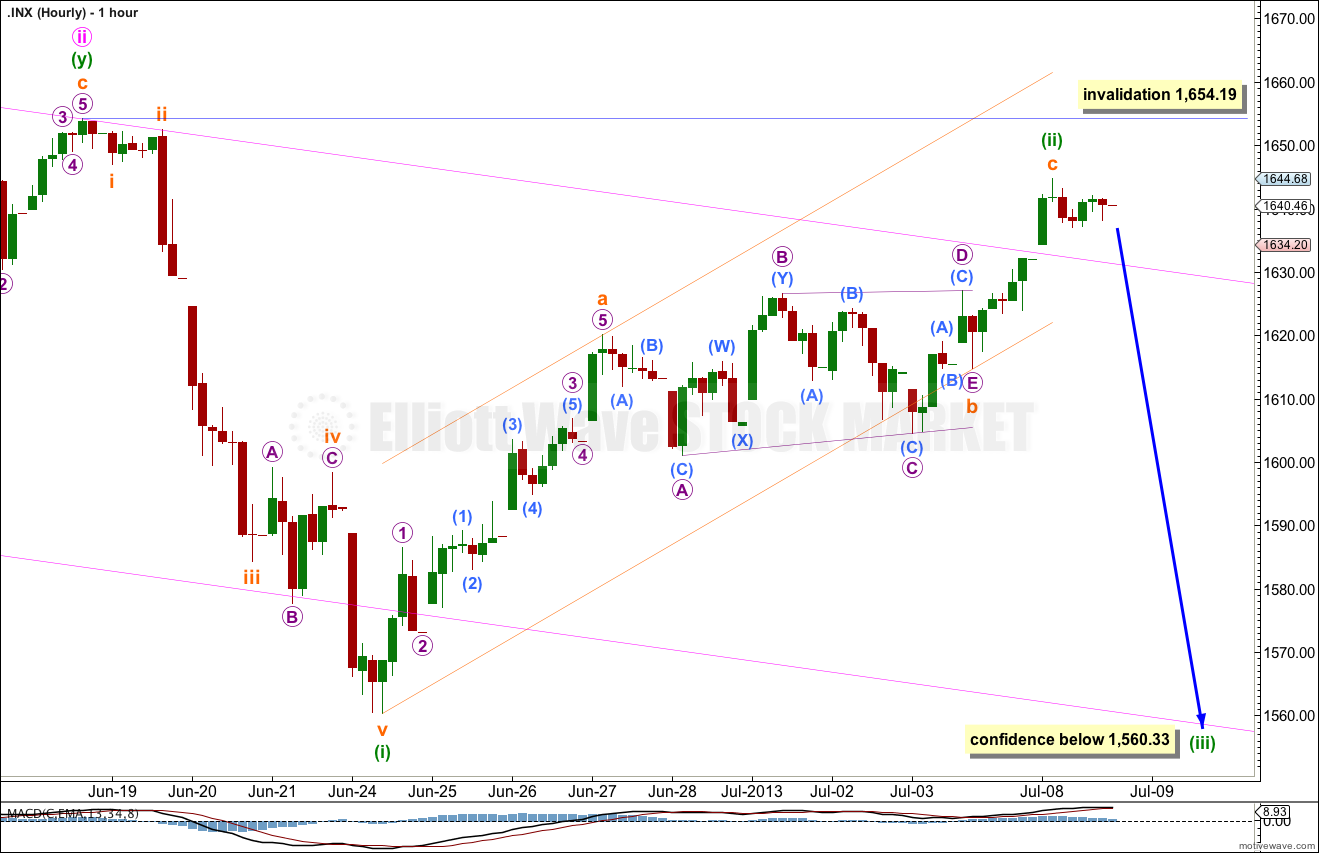
The second hourly wave count below looks at the less likely scenario that minor wave 1 may be unfolding as a leading diagonal.
Minor wave 2 may not move beyond the start of minor wave 1. This wave count is invalidated with movement above 1,687.18.
If minor wave 1 is unfolding as an impulse then within it minute waves i and ii are complete, and within minute wave iii minuette waves (i) and now (ii) are complete.
Within minuette wave (ii) subminuette wave c has no Fibonacci ratio to subminuette wave a.
Minuette wave (iii) must move beyond the end of minuette wave (i). This rule would be met with movement below 1,560.33. At that stage we may have confidence in this wave count.
If minuette wave (ii) moves any higher then it may not move beyond the start of minuette wave (i). This wave count is invalidated with movement above 1,654.19. If that happens this week then the second hourly chart below should be used.
It is possible that minor wave 1 may be unfolding as a leading diagonal.
Within the leading diagonal only minute wave i would definitely be complete. It may not be over at the low labeled minuette wave (a) at 1,598.23 because then minute wave ii would not subdivide correctly as a single zigzag. The upwards movement labeled here as minuette wave (b) within minute wave i cannot be seen as a single zigzag, it must be a double.
Minute wave ii so far is a 0.66 correction of minute wave i which is within the common range for diagonals of between 0.66 to 0.81.
So far this structure would have a typical look.
If minute wave ii moves higher then it would most likely end before 1,663 where it would reach 0.81 of minute wave i.
Minute wave ii may not move beyond the start of minute wave i. This wave count is invalidated with movement above 1,687.18.
Minute wave iii of the diagonal must move beyond the end of minute wave i. This rule would be met with movement below 1,560.33.
Alternate Wave Count.
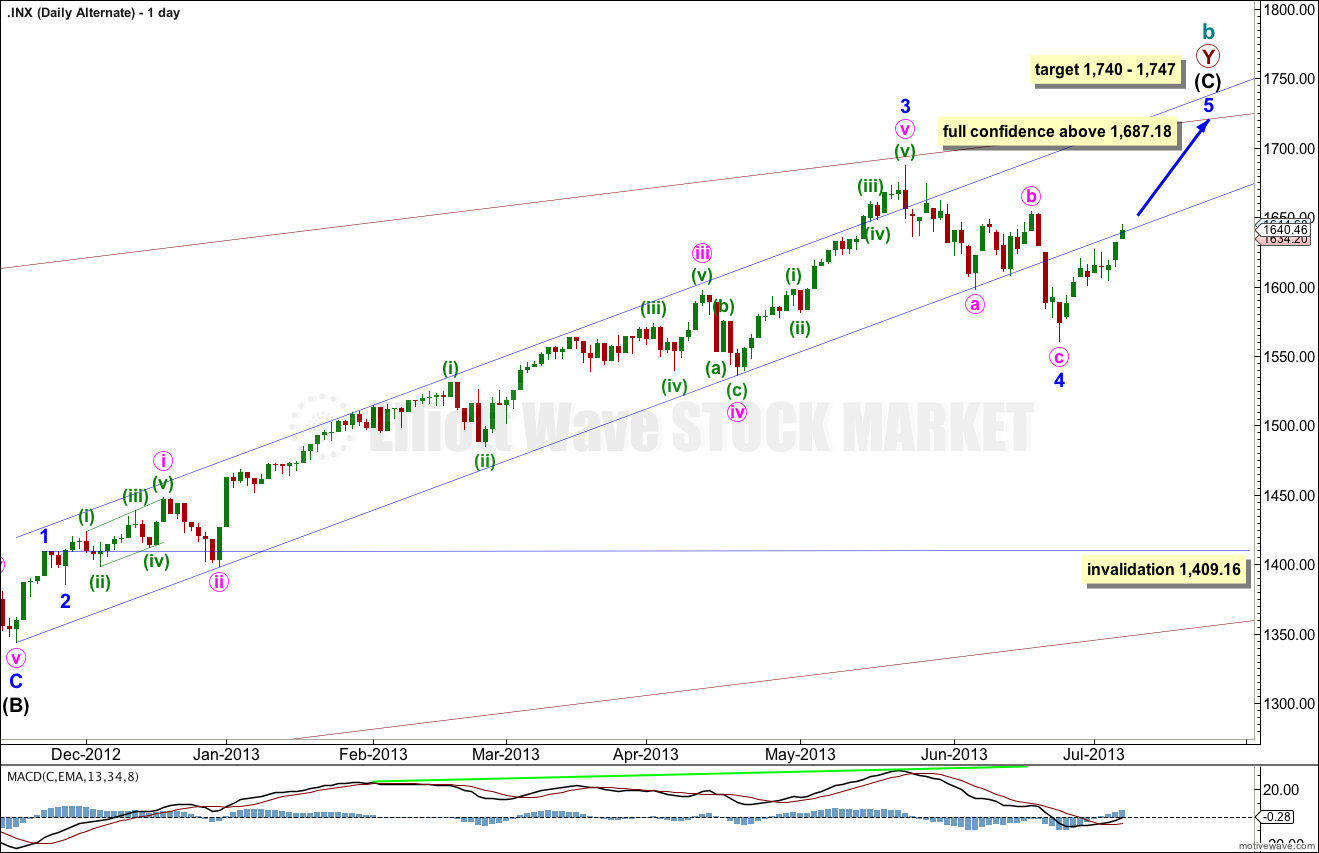
The biggest problem with this wave count and the reason it is an alternate is the size of minor wave 4: it is out of proportion to all the other corrections within intermediate wave (C) and clearly breaches a channel containing intermediate wave (C) no matter how that channel is drawn. Sometimes fourth waves do this and so we must consider this possibility.
Within intermediate wave (C) minor wave 3 is 23 points longer than 4.236 the length of minor wave 1.
The lack of classic technical divergence between price and MACD supports this wave count. A final fifth wave up with slowing momentum would provide divergence and give a typical look.
At 1,740 intermediate wave (C) would reach equality with intermediate wave (A). At 1,747 minor wave 5 would reach 0.618 the length of minor wave 3.
Minor wave 4 may not move into minor wave 1 price territory. This wave count is invalidated with movement below 1,409.16.
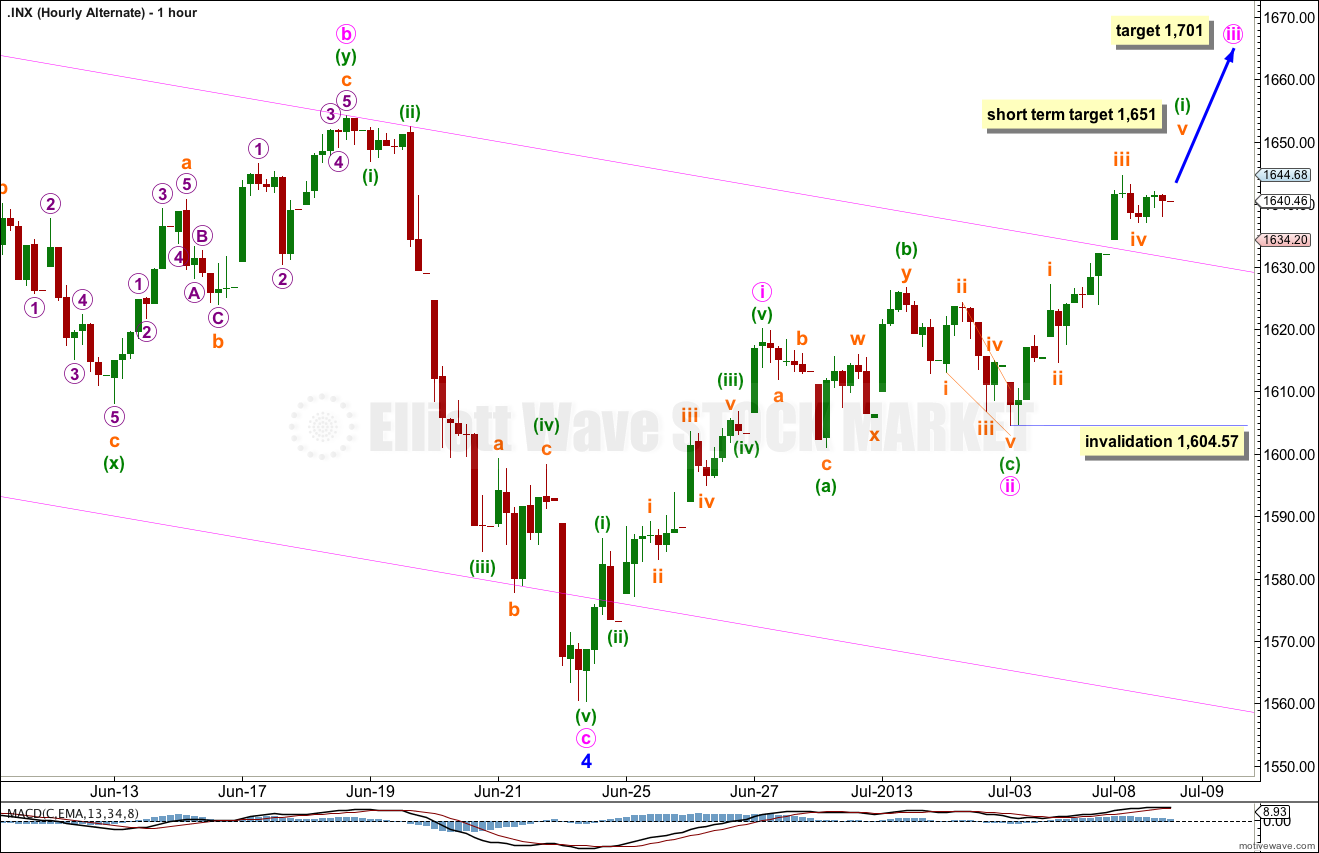
Minor wave 5 must subdivide into a five wave structure, either an impulse (most likely) or an ending diagonal (less likely). So far it looks like it may be an impulse.
Within minor wave 5 minute waves i and ii are complete. Minute wave ii subdivides only as a rare running flat which further slightly reduces the probability of this wave count.
Within minute wave iii minuette wave (i) is close to completion.
Within minuette wave (i) there is no Fibonacci ratio between subminuette waves i and iii. At 1,651 subminuette wave v would reach 0.618 the length of subminuette wave i.
Minuette wave (ii) may not move beyond the start of minuette wave (i). This wave count is invalidated with movement below 1,604.57.
If this hourly wave count is invalidated with movement below 1,604.57 then I would look at the possibility that minor wave 5 may be unfolding as an ending diagonal. The invalidation point for this possibility would lie at 1,560.33.