
Last week’s analysis of gold expected upwards movement from a low of 1,221.88. Price moved lower first to reach down to 1,180.40, $41.48 below where I had expected the low to be.
However, we did not see a trend channel breach on the hourly chart and did not have confirmation that a low was in place, until after price moved lower. With a very clear channel breach now we may be more confident that gold is in an upwards correction to last a few more weeks.
Click on the charts below to enlarge.
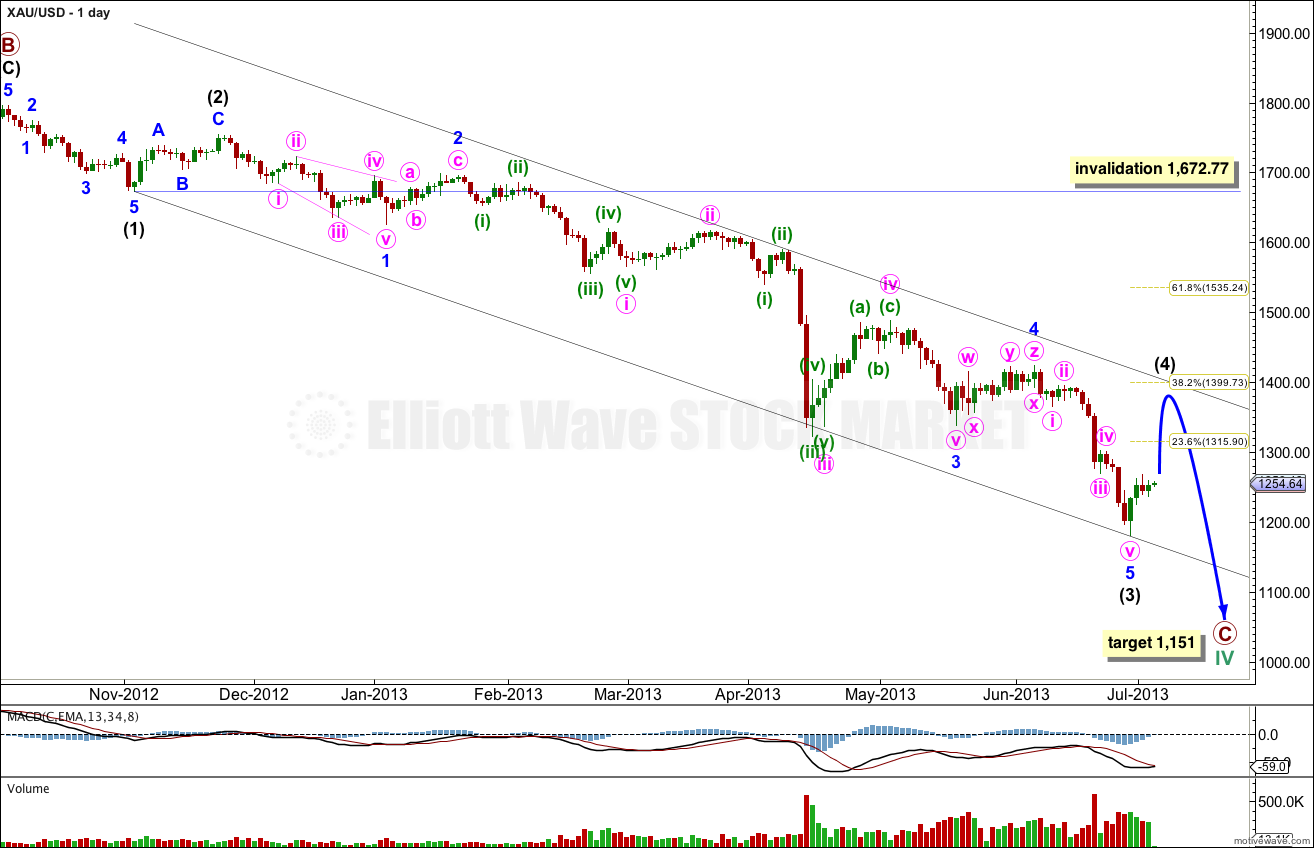
This daily chart focuses on the new downwards trend of primary wave C.
Within primary wave C intermediate waves (1) and (2), and possibly also (3), are complete.
Intermediate wave (3) is now 51.96 longer than 4.236 the length of intermediate wave (1). Although this is a big difference because these waves are at intermediate wave degree the difference is 9%. I consider less than a 10% variation an acceptable Fibonacci ratio.
Ratios within intermediate wave (3) are: minor wave 3 is 21.24 longer than 2.618 the length of minor wave 1, and minor wave 5 is 22.23 longer than 0.618 the length of minor wave 3.
Intermediate wave (4) may last about three to six weeks, depending upon what structure it takes. Intermediate wave (2) lasted three weeks and was a deep 66% zigzag. Intermediate wave (4) may last three or more weeks and is most likely to be a relatively shallow flat, triangle or combination.
Intermediate wave (4) may end at either the 0.236 or 0.382 Fibonacci ratios. When there is more structure within this fourth wave to analyse then a target for it to end may be calculated.
Intermediate wave (4) may find resistance at the upper edge of the parallel channel drawn here using Elliott’s first technique. Draw the first trend line from the lows of intermediate waves (1) to (3), then place a parallel copy upon the extreme within intermediate wave (3).
At 1,151 primary wave C would reach 1.618 the length of primary wave A. This target is a long term target.
Within primary wave C intermediate wave (4) may not move into intermediate wave (1) price territory. This wave count is invalidated with movement above 1,672.77
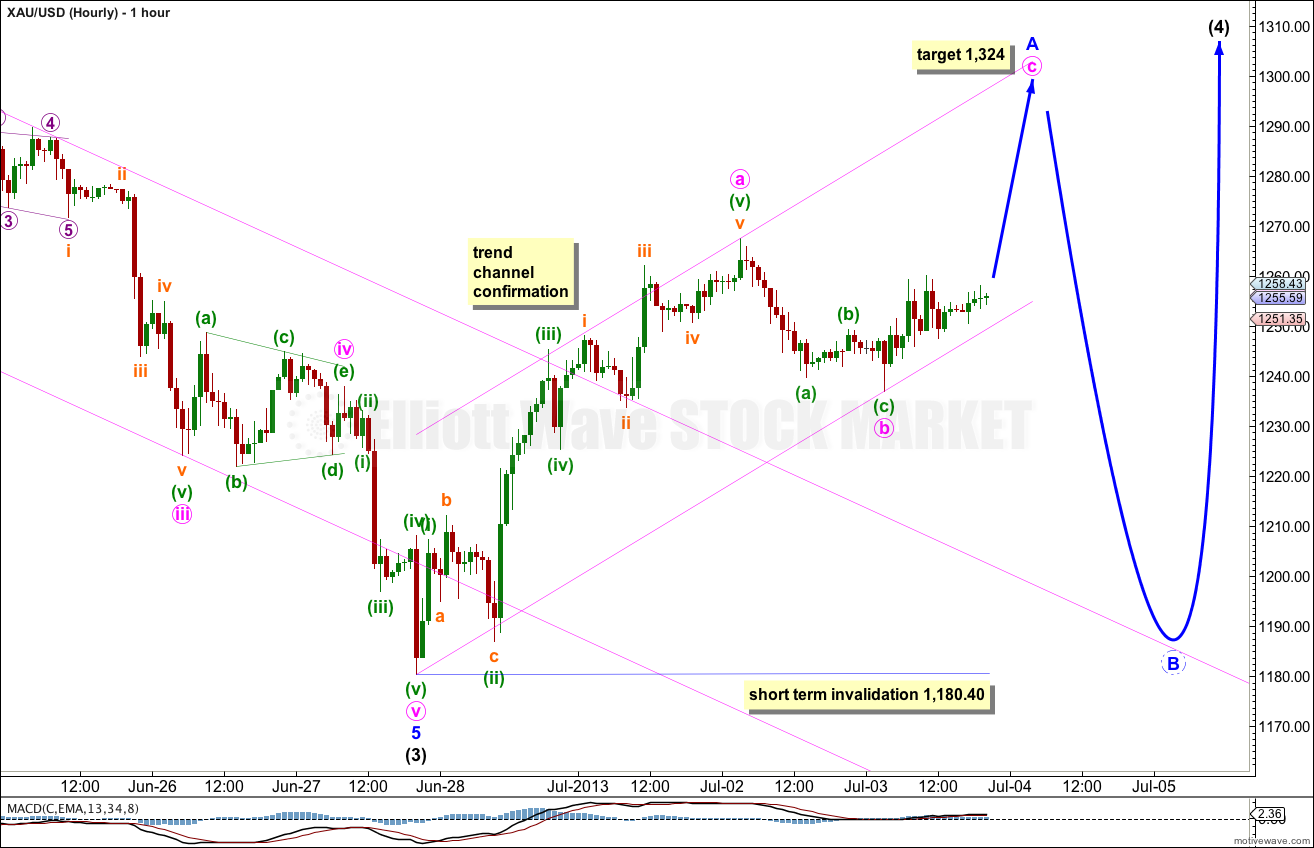
So far we have a very clear trend channel breach of the downwards movement labeled intermediate wave (3). We may consider this confirmation that the downwards impulse is now over and an upwards correction at intermediate degree has begun.
Given the guideline of alternation intermediate wave (4) is most likely to be (in order of probability) a flat, combination or triangle.
At this stage minor wave A within it may be an incomplete three wave structure. If intermediate wave (4) is unfolding as a flat then minor wave A within it is most likely to be a zigzag. At 1,324 minute wave c would reach equality in length with minute wave a.
Ratios within minute wave a are: minuette wave (iii) has no Fibonacci ratio to minuette wave (i), and minuette wave (v) is just 1.19 short of 1.618 the length of minuette wave (i).
Ratios within minuette wave (v) are: subminuette wave iii has no Fibonacci ratio to subminuette wave i, and subminuette wave v is just 0.54 short of 0.618 the length of subminuette wave iii.
Within the zigzag of minor wave A minute wave a is complete. Minute wave b may be complete, or it may yet move price lower. If it does then it may not move beyond the start of minute wave a. Movement below 1,180.40 in the short term (before minor wave A is a clearly complete zigzag) would invalidate this wave count at minor wave degree.
When minor wave A is complete then minor wave B should move down to at least 90% the length of minor wave A, and is likely to make a new low below the start of minor wave A at 1,180.40 because the most common type of flat is an expanded flat and this requires minor wave B to be a minimum of 105% the length of minor wave A.
Overall intermediate wave (4) should be choppy, overlapping and should last another two to four weeks.