
The S&P moved mostly sideways and a little lower during a very quiet short session just before market close prior to the 4th of July holiday.
Markets are closed for Thursday, 4th July holiday and reopen for Friday, 5th July. I expect Friday may be another quiet session.
We may not have clarity between these two wave counts this week due to the holiday. We may have to wait for next week to see price break out of this range.
Click on the charts below to enlarge.
Main Wave Count.

The widest maroon channel is copied over from the monthly chart and contains all of cycle wave b. It may be that price found final resistance at the upper edge of this channel.
The black channel in the middle is drawn about the zigzag of primary wave Y. Draw the first trend line from the start of primary wave Y to the end of intermediate wave (B). Place a parallel copy upon the extreme within intermediate wave (A). The upper edge of this channel also may be where price found resistance and where intermediate wave (C) ended.
The smallest blue channel is the most conservative best fit I can see for intermediate wave (C). It is very clearly breached by downwards movement.
I have looked back to September 2000 on the daily chart at smaller narrow channels about intermediate degree movements. Most of the time a breach like this indicates a trend change, but not always. What would give me more confidence in this trend change is a clear breach of the black intermediate degree channel. When that is breached I will calculate long term downwards targets for you.
There is no classic technical divergence between price and MACD on the daily or weekly charts. This is possible, but unusual for the S&P 500. This must reduce the probability of this wave count. We must still seriously consider the alternate.
There are no Fibonacci ratios between minor waves 1, 3 and 5 within intermediate wave (C). There is no Fibonacci ratio between intermediate waves (A) and (C). This lack of Fibonacci ratios slightly reduces the probability of this main wave count.
Minor wave 2 may not move beyond the start of minor wave 1. This wave count is invalidated with movement above 1,687.18.

Minuette wave (ii) may have been over with subminuette wave c an ending diagonal with a truncated fifth wave. This is possible, although the fifth wave of the diagonal is shorter than the third. As long as the third wave is not the shortest conforming to a core Elliott wave rule then I would accept this structure.
With the truncation the orthodox length of subminuette wave c is now only 0.38 points longer than 0.382 the length of subminuette wave a.
Within minuette wave (iii) we may now have a first and small second wave expanded flat correction complete. If micro wave 2 moves higher it may not move beyond the start of micro wave 1. Movement above 1,624.26 would invalidate this wave count at minuette wave degree.
If this main wave count is correct then next week we should see an increase in downwards momentum. Movement below 1,560.33 would add a high level of confidence to this wave count next week. At that stage the alternate wave count below would significantly reduce in probability.
Alternate Wave Count.
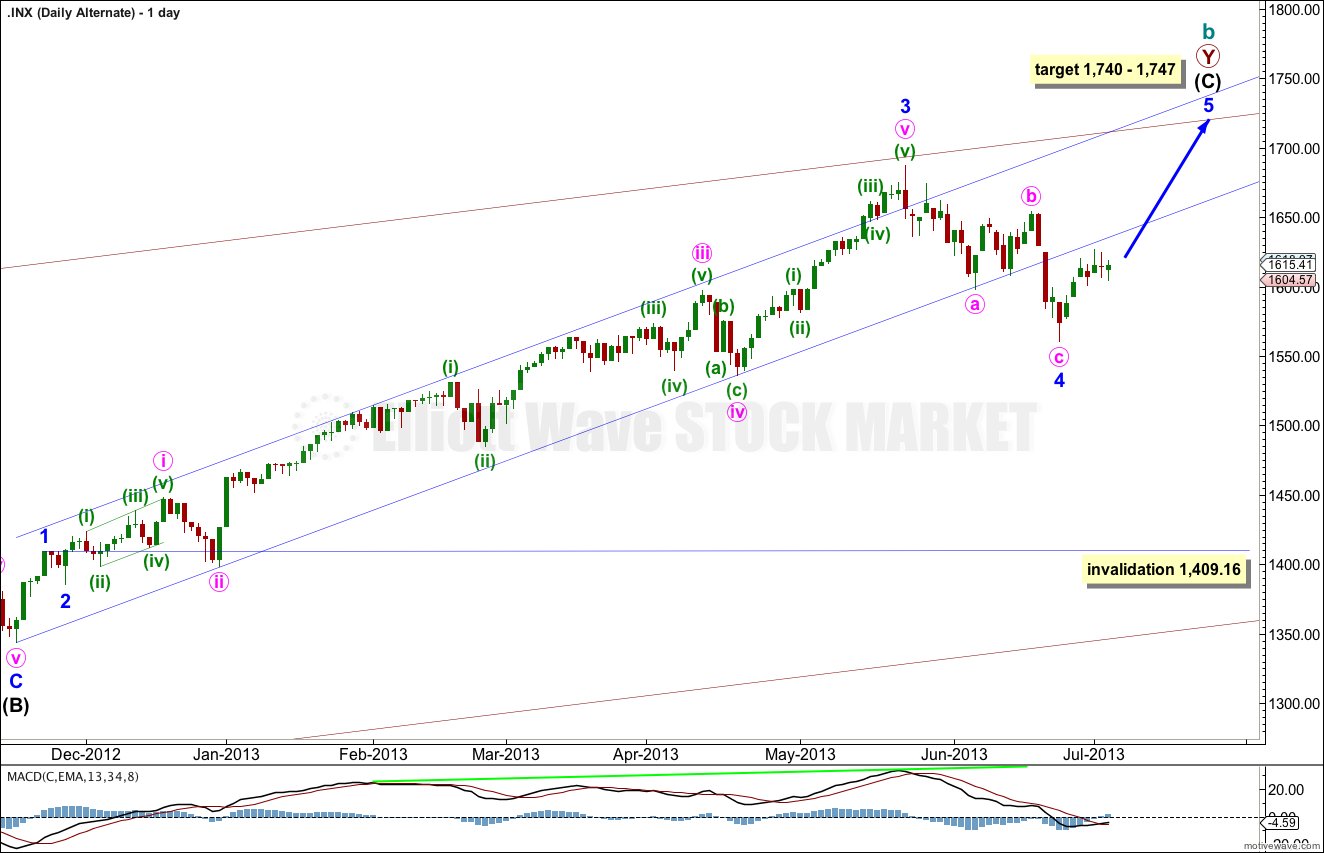
The biggest problem with this wave count and the reason it is an alternate is the size of minor wave 4: it is out of proportion to all the other corrections within intermediate wave (C) and clearly breaches a channel containing intermediate wave (C) no matter how that channel is drawn. Sometimes fourth waves do this and so we must consider this possibility.
Within intermediate wave (C) minor wave 3 is 23 points longer than 4.236 the length of minor wave 1.
The lack of classic technical divergence between price and MACD supports this wave count. A final fifth wave up with slowing momentum would provide divergence and give a typical look.
At 1,740 intermediate wave (C) would reach equality with intermediate wave (A). At 1,747 minor wave 5 would reach 0.618 the length of minor wave 3.
Minor wave 4 may not move into minor wave 1 price territory. This wave count is invalidated with movement below 1,409.16.
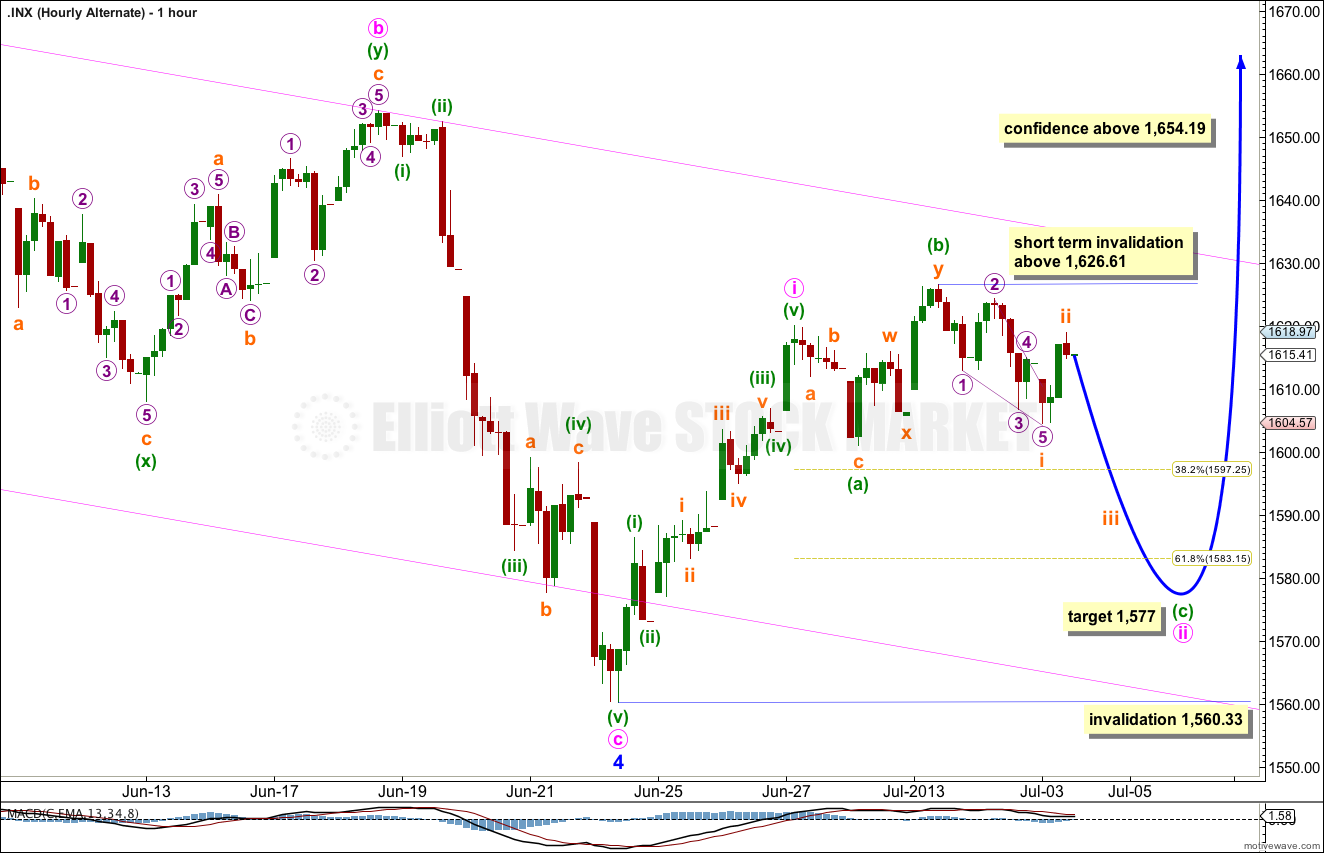
The failure of the prior structure labeled as a leading diagonal to complete indicates that yesterday’s labeling of this alternate must be wrong. It is more likely now that minute wave ii is incomplete.
Minute wave ii may be unfolding as an expanded flat correction. Within this structure minuette wave (a) unfolds as a zigzag, minuette wave (b) unfolded as a double zigzag and minuette wave (c) would most likely be incomplete.
Within minuette wave (c) subminuette wave i may have been a small leading diaognal. Subminuette wave ii may be over as a deep zigzag, or this may only be wave A within subminuette wave ii. If it moves any higher it may not move beyond the start of subminuette wave i at 1,626.61.
Minuette wave (c) is extremely likely to move below the end of minuette wave (a) at 1,601.06 to avoid a truncation and a rare running flat. At 1,577 minuette wave (c) would reach 2.618 the length of minuette wave (a).
Minute wave ii may not move beyond the start of minute wave i. This wave count is invalidated with movement below 1,560.33.