
Last analysis expected downwards movement for the main hourly wave count, and upwards movement for the alternate. Price has moved higher. Both wave counts remain valid.
In the short term for the start and most of tomorrow’s session both wave counts expect the same direction of movement next and have the same short term target.
Click on the charts below to enlarge.
Main Wave Count.
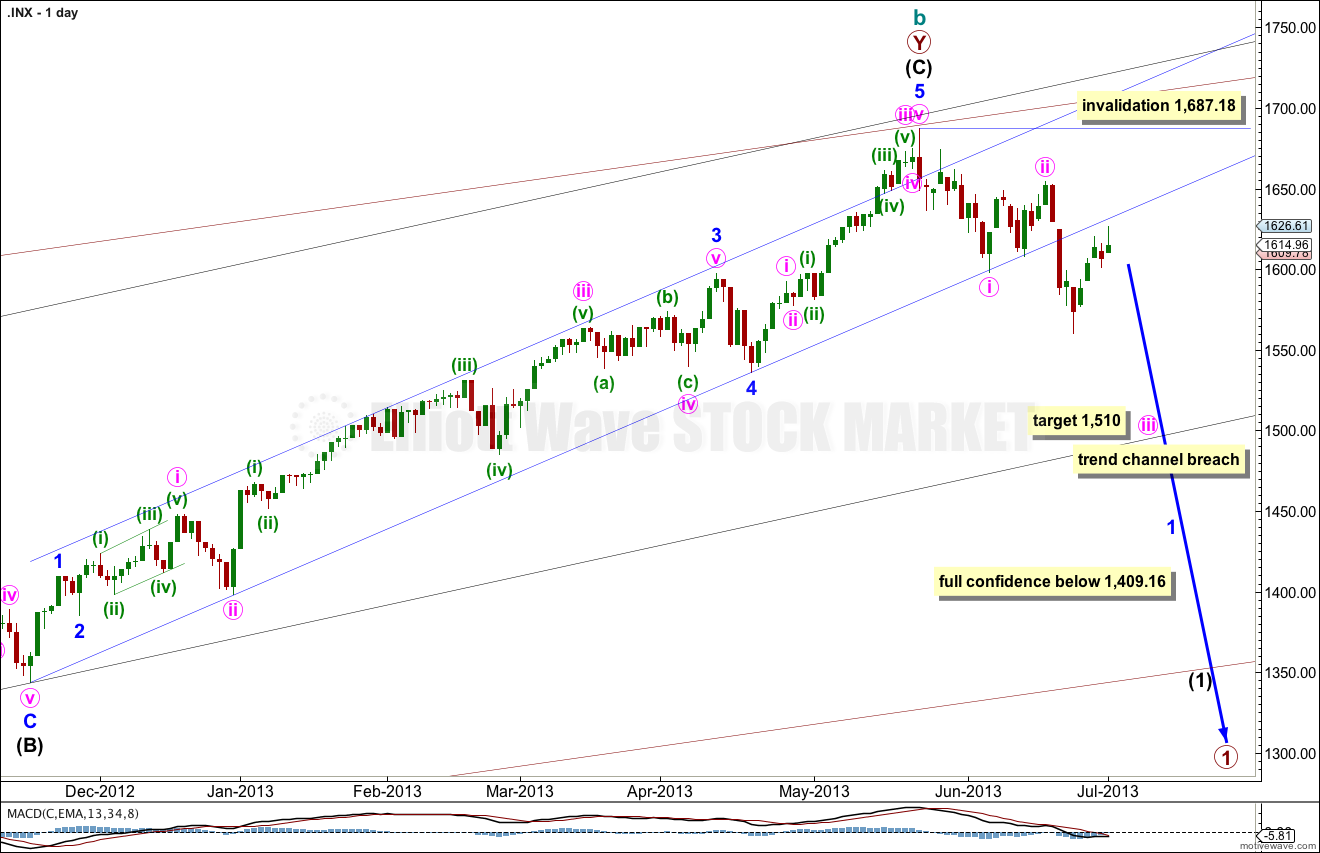
The widest maroon channel is copied over from the monthly chart and contains all of cycle wave b. It may be that price found final resistance at the upper edge of this channel.
The black channel in the middle is drawn about the zigzag of primary wave Y. Draw the first trend line from the start of primary wave Y to the end of intermediate wave (B). Place a parallel copy upon the extreme within intermediate wave (A). The upper edge of this channel also may be where price found resistance and where intermediate wave (C) ended.
The smallest blue channel is the most conservative best fit I can see for intermediate wave (C). It is very clearly breached by downwards movement.
I have looked back to September 2000 on the daily chart at smaller narrow channels about intermediate degree movements. Most of the time a breach like this indicates a trend change, but not always. What would give me more confidence in this trend change is a clear breach of the black intermediate degree channel. When that is breached I will calculate downwards targets for you.
There is no classic technical divergence between price and MACD on the daily or weekly charts. This is possible, but unusual for the S&P 500. This must reduce the probability of this wave count. We must still seriously consider the alternate.
There are no Fibonacci ratios between minor waves 1, 3 and 5 within intermediate wave (C). There is no Fibonacci ratio between intermediate waves (A) and (C). This lack of Fibonacci ratios slightly reduces the probability of this main wave count.
Minor wave 2 may not move beyond the start of minor wave 1. This wave count is invalidated with movement above 1,687.18.
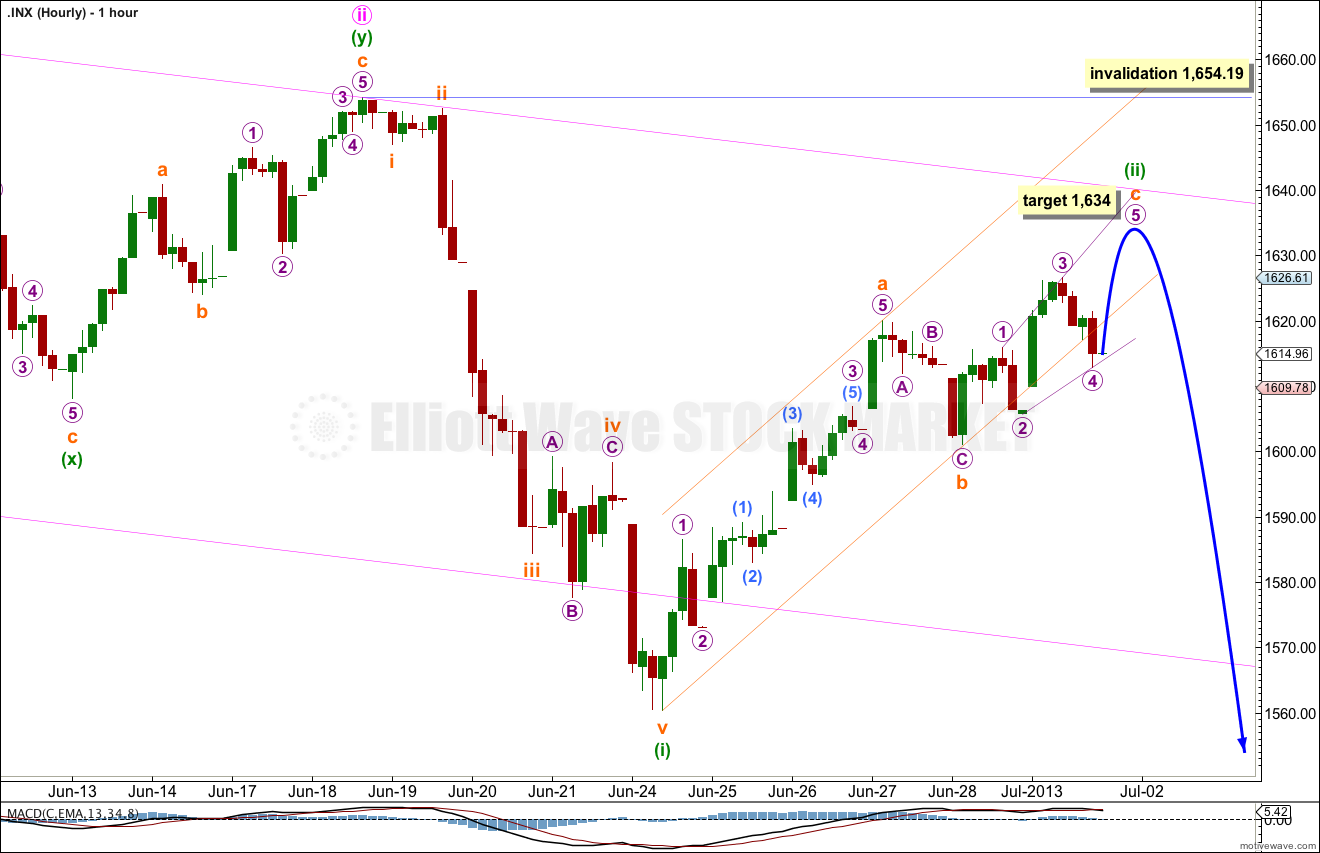
Upwards movement invalidated the labeling of minuette wave (ii) as complete. This must be a continuation of this second wave correction.
Within minuette wave (ii) subminuette wave a is an impulse, subminuette wave b a zigzag, and subminuette wave c is unfolding as an ending expanding diagonal.
Within the expanding diagonal the final fifth wave of micro wave 5 must unfold as a zigzag and is most likely to be longer than micro wave 2. Micro wave 5 would reach equality with micro wave 3 at 1,633.78, so it should end about 1,634 or a little above.
When the ending diagonal is complete then this main wave count expects downwards movement. Minuette wave (iii) should show an increase in momentum beyond that seen for minuette wave (i) down.
Minuette wave (ii) may not move beyond the start of minuette wave (i). This wave count is invalidated with movement above 1,654.19.
Alternate Wave Count.
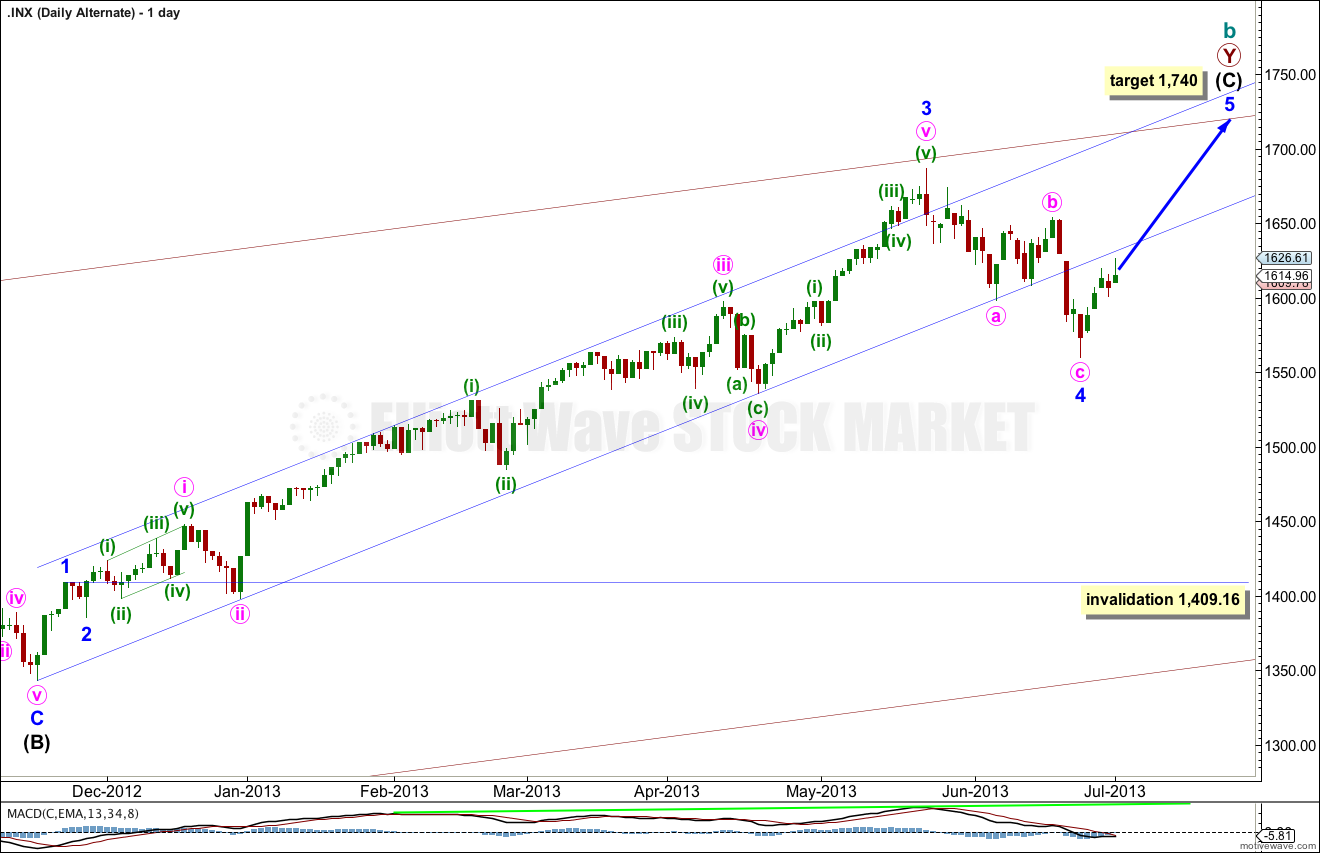
The biggest problem with this wave count and the reason it is an alternate is the size of minor wave 4: it is out of proportion to all the other corrections within intermediate wave (C) and clearly breaches a channel containing intermediate wave (C) no matter how that channel is drawn. Sometimes fourth waves do this and so we must consider this possibility.
Within intermediate wave (C) minor wave 3 is 23 points longer than 4.236 the length of minor wave 1.
The lack of classic technical divergence between price and MACD supports this wave count. A final fifth wave up with slowing momentum would provide divergence and give a typical look.
At 1,740 intermediate wave (C) would reach equality with intermediate wave (A).
Minor wave 4 may not move into minor wave 1 price territory. This wave count is invalidated with movement below 1,409.16.
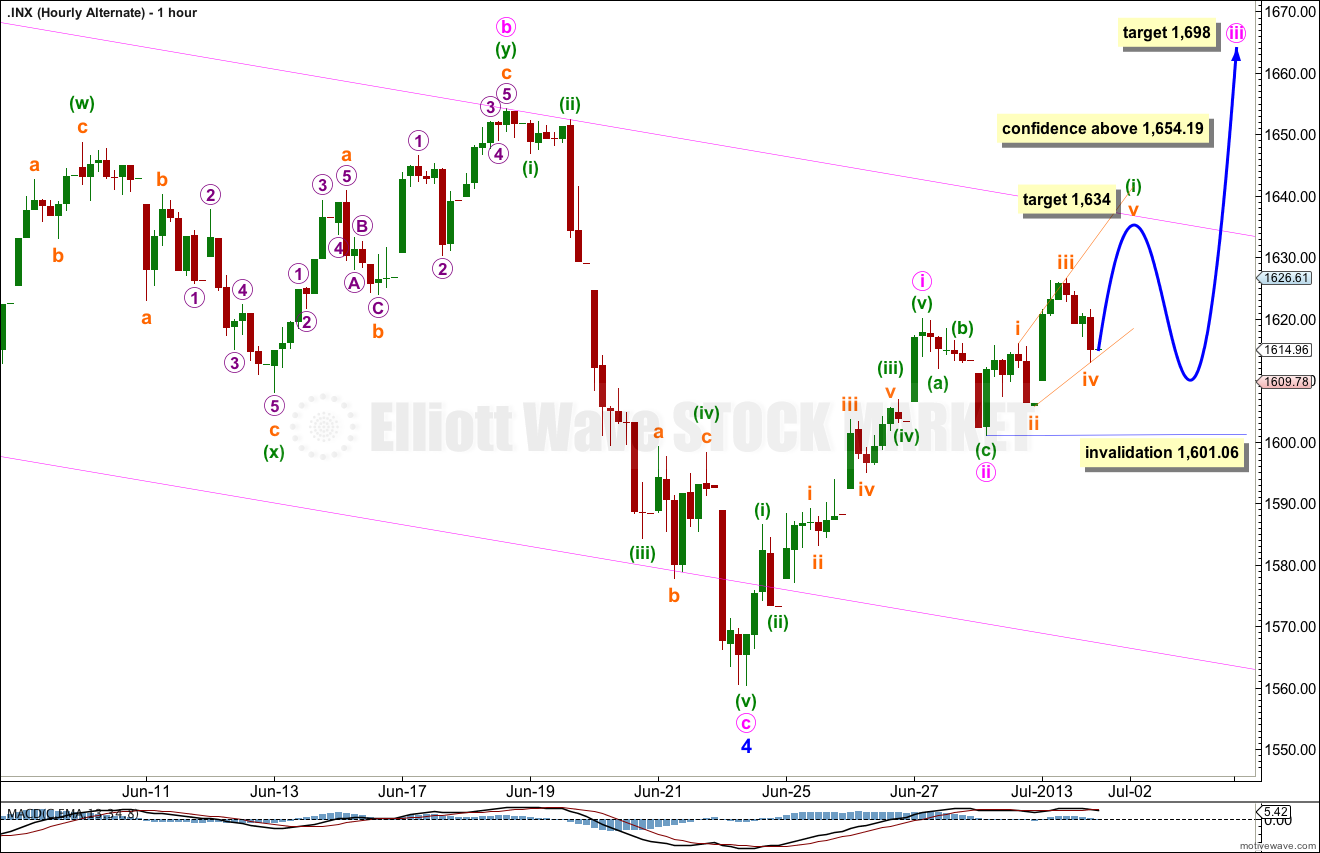
If minute wave iii has begun then minuette wave (i) within it is unfolding as a leading expanding diagonal which is incomplete.
Minuette wave (i) may end about 1,634 where subminuette wave v of the diagonal is just a little longer than subminuette wave iii. This may also be where price finds resistance at the upper end of the parallel channel containing minor wave 4.
When the leading diagonal for minuette wave (i) is complete then we should expect a very deep correction for minuette wave (ii) to follow it. Minuette wave (ii) may not move beyond the start of minuette wave (i). This wave count is invalidated with movement below 1,601.06.