
Last analysis of US Oil was two weeks ago. It expected upwards movement to complete a second wave correction with a target at 98.36 and an invalidation point very close to that at 100.43.
Price moved higher as expected to reach 99.21, just 0.85 above the target, before turning strongly downwards.
The wave count remains the same.
Click on the charts below to enlarge.
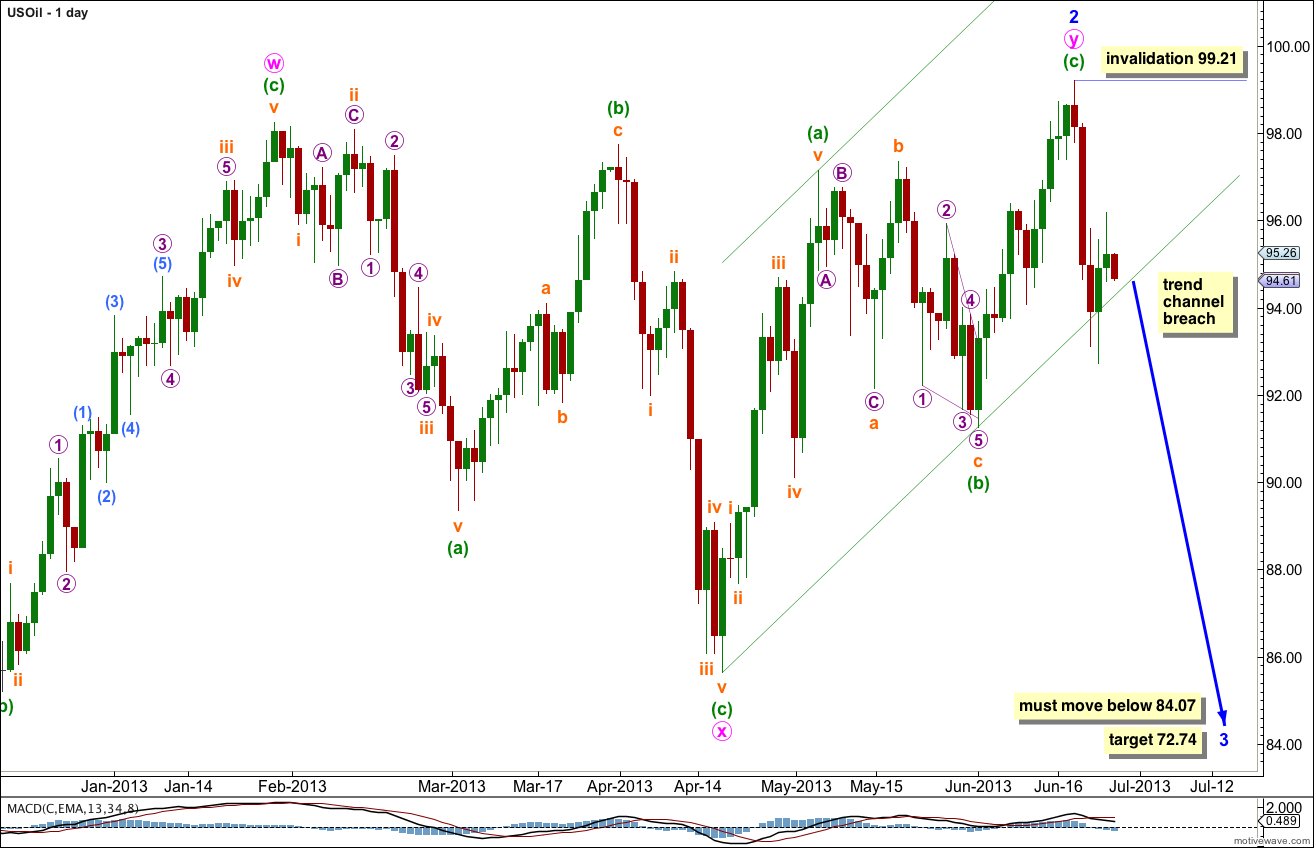
This wave count sees US Oil in a third wave downwards at intermediate degree, within a primary wave C down.
Within intermediate wave (3) minor waves 1 and now also 2 are both probably complete. The next movement downwards should be a strong third wave.
I have drawn a parallel channel about the second zigzag in the double of minor wave 2. When this channel is clearly breached with at least one full daily candlestick below it and not touching the lower trend line then we shall have trend channel confirmation of a trend change. At this stage we have an overshoot only, not a clear channel breach.
However, there is no room left for upwards movement for minor wave 2. Also, it is a double zigzag structure which is reasonably common and for it to continue further would see it unfold as a very rare triple. The probability that this correction is finally over is extremely high.
We should expect Oil to continue to fall with an increase of downwards momentum. In the next few weeks to months we may see some explosive downwards movement.
Minor wave 3 must move below the end of minor wave 1 at 84.07. At 72.74 minor wave 3 would reach 1.618 the length of minor wave 1. This target is weeks away.
When minute waves i through to iv within minor wave 3 are complete then the target calculation may be done at a second wave degree. The target of 84.07 may widen into a zone or it may change as there is more structure to analyse.
Within minor wave 3 no second wave correction may move beyond the start of its first wave. This wave count is invalidated with movement above 99.21.
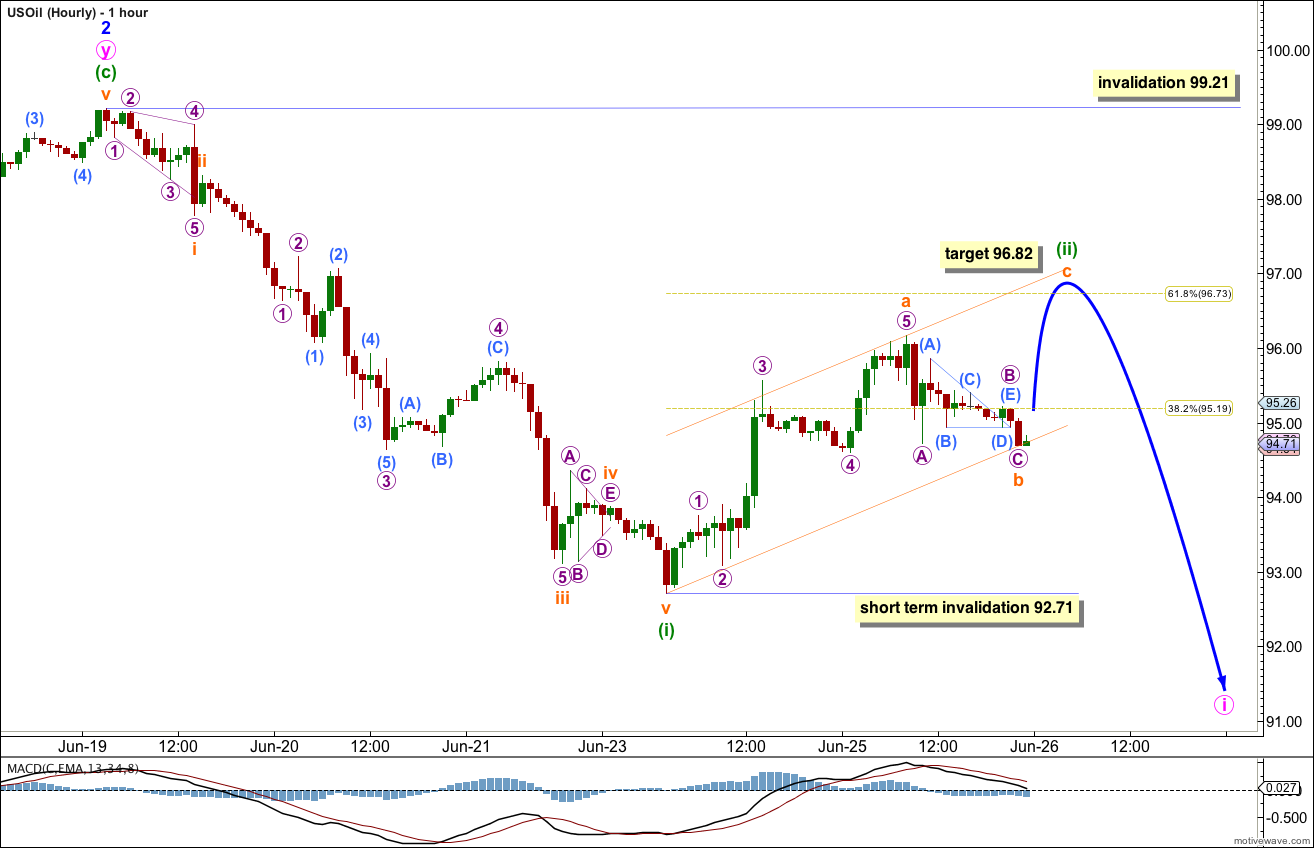
So far within minute wave iii we may have the end of minuette wave (i) within minor wave i.
Ratios within minuette wave (i) are: there is no Fibonacci ratio between subminuette waves i and iii, and subminuette wave v is 0.07 short of 0.236 the length of subminuette wave i.
Ratios within subminuette wave iii are: micro wave 3 is 0.14 short of 1.618 the length of micro wave 1, and micro wave 5 is just 0.01 longer than 1.618 the length of subminuette wave i.
Ratios within micro wave 3 are: submicro wave (3) is 0.03 longer than 1.618 the length of micro wave 1, and micro wave 5 has no Fibonacci ratio to either of micro waves 1 or 3.
Within micro wave 4 submicro wave (C) is 0.01 longer than 2.618 the length of submicro wave (A).
Ratios within subminuette wave a of minuette wave (ii) are: micro wave 3 has no Fibonacci ratio to micro wave 1, and micro wave 5 is 0.13 short of 1.618 the length of micro wave 1.
At 96.82 subminuette wave c would reach 0.618 the length of subminuette wave a, and minuette wave (ii) would end just above the 0.618 Fibonacci ratio of minuette wave (i). If subminuette wave b moves lower the target at 96.82 must also move correspondingly lower.
While minuette wave (ii) is incomplete any further downwards movement of subminuette wave b may not move beyond the start of subminuette wave a at 92.71.
When we have upwards movement for subminuette wave c then this short term invalidation point will no longer apply.
We may expect subminuette wave c to find resistance at the upper edge of the channel drawn about minuette wave (ii).
This second wave correction should be over within 24 to 48 hours. I expect a trend change during the next week. The next movement downwards should see an increase in downwards momentum.