
Again, last week expected upwards movement from the Dow. Price initially moved higher, but then turned downwards to have an overall downwards week. Price has managed so far to remain just above the invalidation point on the daily chart. If this price point holds we should expect new all time highs for the Dow. If this price point is breached we may have seen a trend change at cycle degree.
I have a new alternate daily wave count for you this week.
Click on the charts below to enlarge.
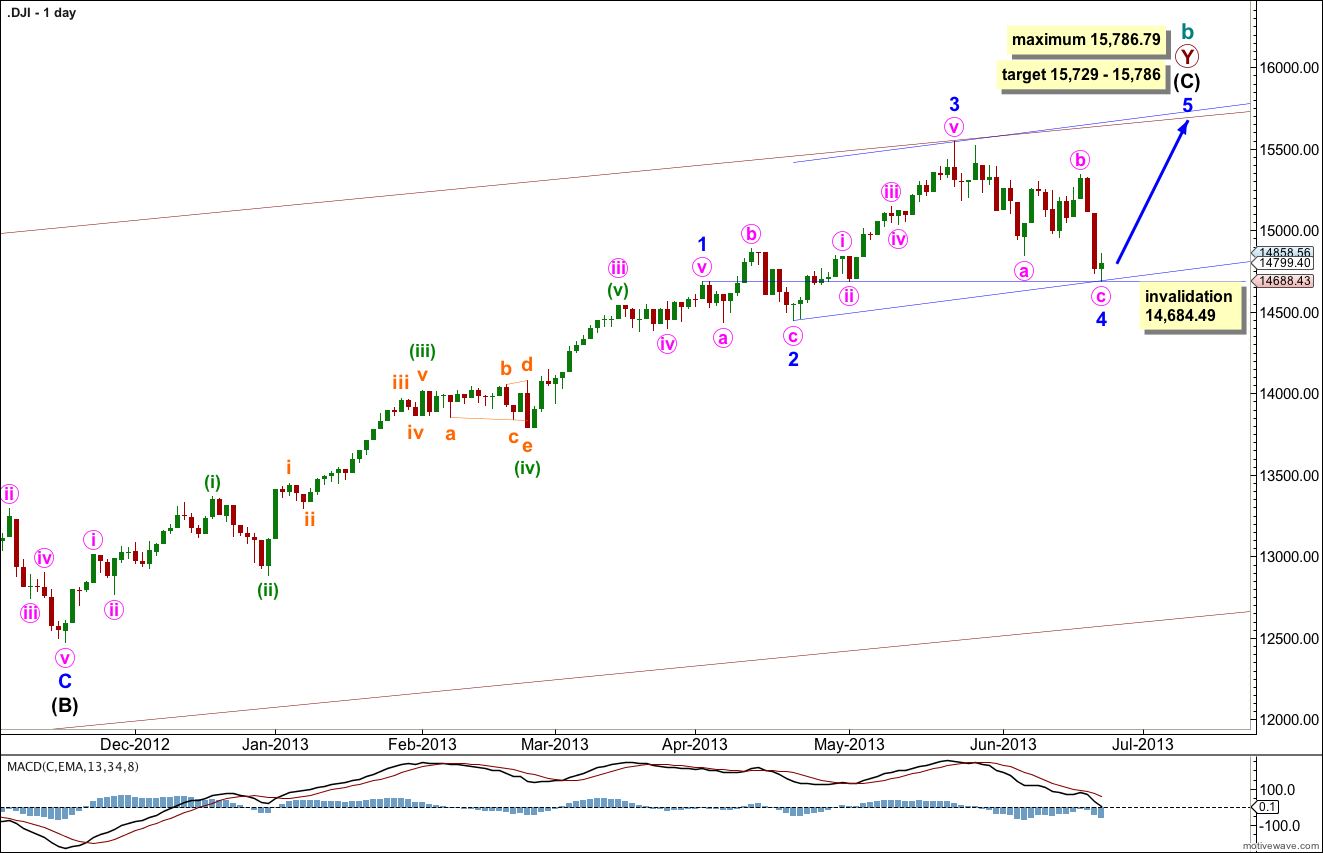
There are several possible ways to label this long upwards movement of intermediate wave (C). This wave count sees minor waves 1 through to 4 complete with the first wave extended. This interpretation sees the strongest momentum as within the third wave, it agrees with MACD.
Minor wave 2 is now seen as a rare running flat (the subdivisions fit nicely) and minor wave 4 shows nice alternation as double zigzag.
Because minor wave 3 is shorter than minor wave 1 the upcoming minor wave 5 will be limited to no longer than equality with minor wave 3, as a third wave may never be the shortest wave. This limit is reached at 15,786.79.
There is no Fibonacci ratio between minor waves 1 and 3. This makes it more likely there will be a Fibonacci ratio between minor wave 5 and either of 1 or 3. At 15,786 wave 5 would reach equality the length of minor wave 3.
At 15,729 intermediate wave (C) would reach equality with intermediate wave (A).
Draw a channel about intermediate wave (C) using Elliott’s second technique. Draw the first trend line from the ends of minor waves 2 to 4, then place a parallel copy upon the high of minor wave 3. Expect minor wave 5 to find resistance about the upper edge of the channel.
The wide maroon channel is drawn about cycle wave b at the monthly chart level and copied over here to the daily chart. Upwards movement for last week found resistance at the upper maroon trend line and should continue to do so.
Minor wave 4 may not move into minor wave 1 price territory. This wave count is invalidated with movement below 14,684.49.
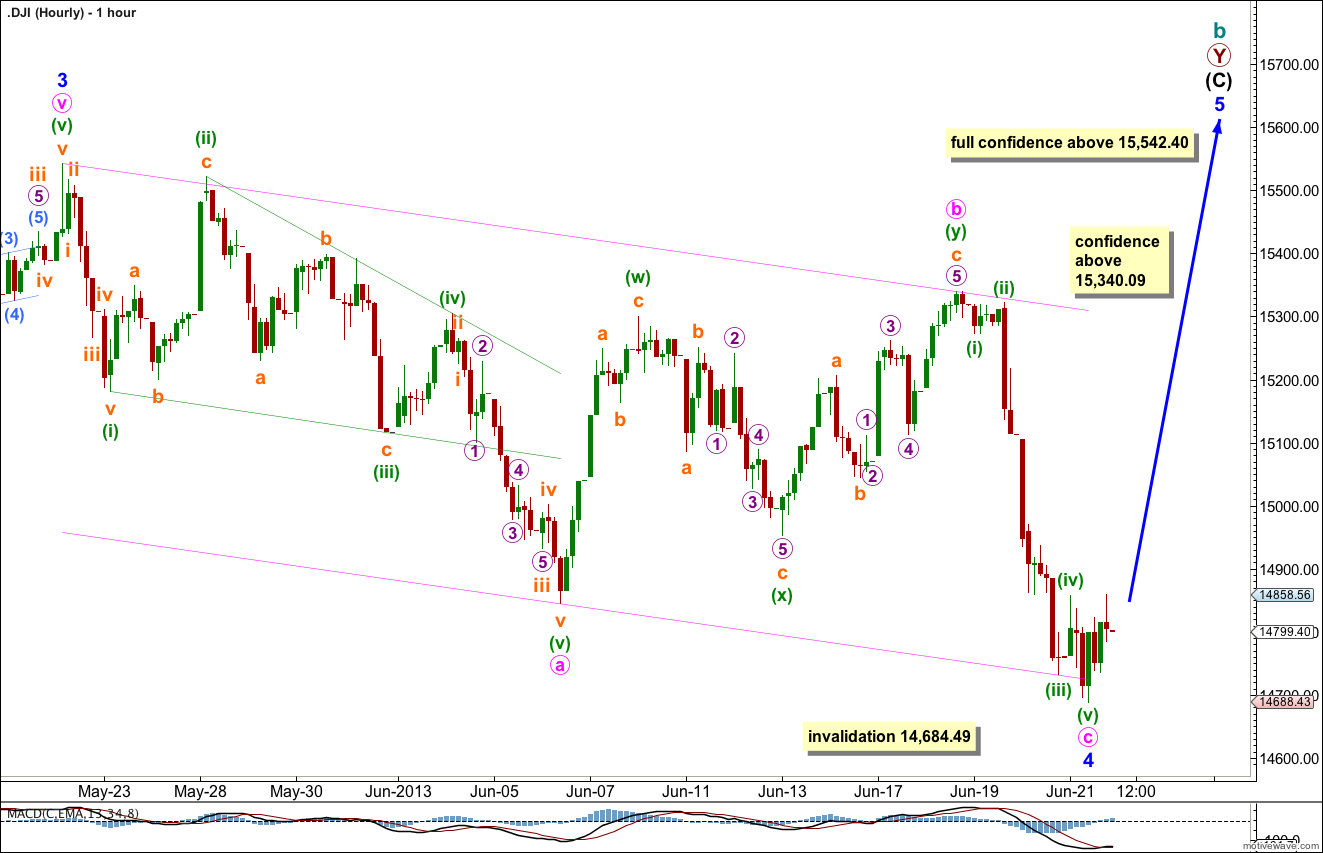
Within minor wave 4 the structure may be unfolding as a zigzag. However, the structure within minute wave a as a leading diagonal is unsatisfactory technically. It is neither contracting nor expanding, but all the subdivisions fit and the core Elliott wave rules are met: minuette wave (iii) is not the shortest and it moves beyond the end of minuette wave (i), and minuette wave (v) is not truncated.
Minute wave b can only be seen subdividing 3-3-3, it cannot be 5-3-5. Particularly the second three up labeled here minute wave (y) fits only as a three. This movement is not ambiguous. This means that this movement must be labeled as a double zigzag. It cannot be a single zigzag.
Because the maximum number of structures within a multiple correction is three this means that waves within multiples cannot themselves subdivide into multiples as that would multiply the number of corrective structures beyond three. For this reason minute wave b cannot be labeled as an X wave within a multiple for minor wave 4. Minor wave 4 must be a zigzag.
Within minor wave 4 minute wave c is 49.48 points short of equality with minute wave a and has found support at the lower edge of the channel drawn using Elliott’s technique about this correction.
When this channel is clearly breached by upwards movement we may have some more confidence in this wave count.
Movement above 15,340.09 would provide further confidence in this wave count. Movement above 15,542.40 would provide full confidence in this wave count. At that stage we may expect overall minor wave 5 to last about four to five weeks.
Alternate Daily Wave Count.
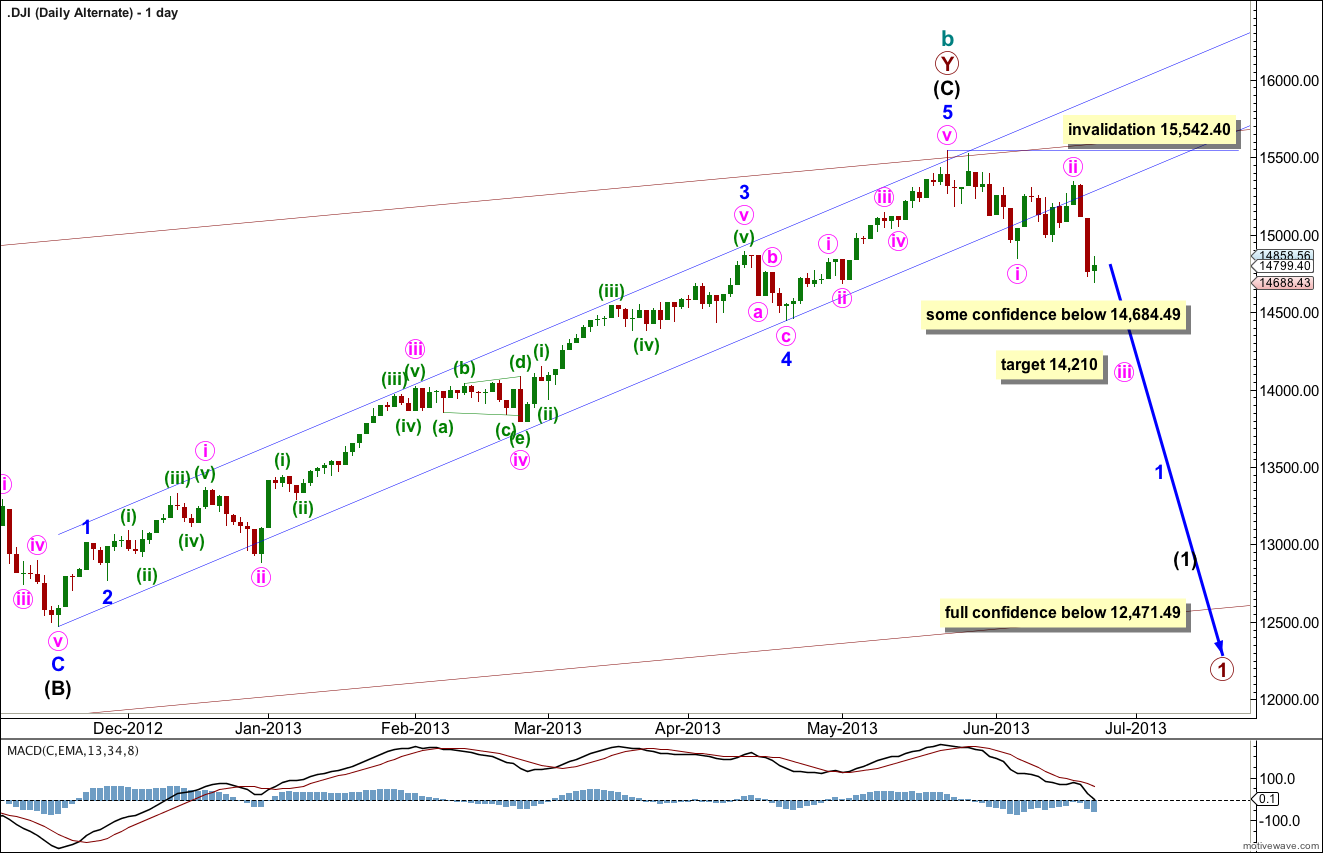
If we draw a best fit parallel channel about intermediate wave (C) we can see it is clearly breached by downwards movement. We must consider the possibility that cycle wave b in its entirety is over and a new downwards trend for cycle wave c to last one to several years and take price substantially below 6,469.95 has begun.
However, we should always assume the trend remains the same, until proven otherwise. Also this alternate wave count does not agree with MACD in that it sees the piece of upwards movement within intermediate wave (C) not as a third wave but as a fifth. This is unusual for the Dow, although the difference in momentum here is slight and not as clear as for the S&P 500.
If we see movement below 14,684.49 we may have some confidence in this alternate as at that stage the main daily wave count would be invalidated. However, there are still other ways to label intermediate wave (C) which still allow for new highs, in that the structure would be incomplete. Full confidence in this trend change at cycle degree would come with price movement below 12,471.49 as at that stage intermediate wave (C) simply would have to be over. This would also bring price below the wider maroon parallel channel containing cycle wave b. That channel breach would give more confidence in a new cycle degree trend.