
Yesterday’s analysis expected Thursday’s session to begin with a very little downwards movement, before turning upwards. This is exactly what happened.
The wave count remains the same and I still have just the one daily and one hourly chart for you.
Click on the charts below to enlarge.
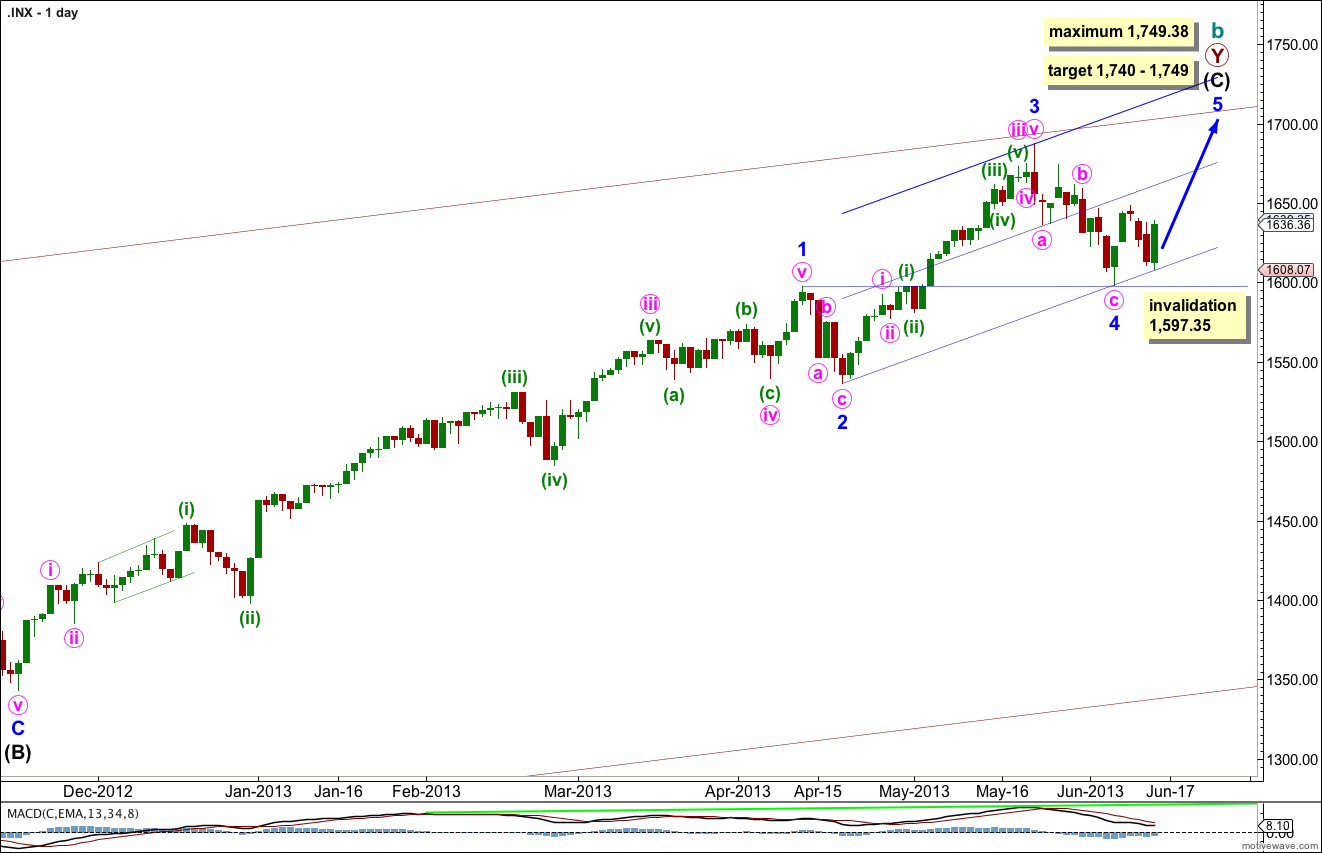
The bigger picture sees upwards movement from the end of the “credit crunch” at 666.76 as a double zigzag structure for a cycle degree b wave lasting so far 4.25 years. The second zigzag is almost complete. When it is done we should see another crash to make substantial new lows below 666.76, if the main monthly wave count is correct. If, however, the next upwards wave sees an increase in momentum beyond that seen for minor wave 3 then the alternate very bullish monthly wave count must be seriously considered. I will be watching momentum carefully over the next few weeks.
Within intermediate wave (C) minor wave 1 was extended.
Minor wave 3 is just 5.82 points short of 0.618 the length of minor wave 1. I would expect the upcoming minor wave 5 to reach equality with minor wave 3. This would be achieved at 1,749.38, and this is also a maximum point for upwards movement because minor wave 3 may not be the shortest wave.
At 1,740 intermediate wave (C) would reach equality with the orthodox length of intermediate wave (A). This gives us a 9 point target zone, and I favour the upper end of the zone because it is calculated at a lower wave degree.
If minor wave 4 were to continue any lower it may not move into minor wave 1 price territory. This wave count is invalidated with movement below 1,597.35.
Draw the channel about intermediate wave (C) using Elliott’s second technique. Draw the first trend line from the lows of minor waves 2 to 4, then place a parallel copy upon the hight of minor wave 3. Add a mid line to the channel. Expect minor wave 5 to end about the mid line, or to find resistance at the upper edge.
The very wide maroon trend channel shown here is copied over from the monthly chart. We may find this movement ends as it finds resistance at the upper trend line.
At this stage there is no divergence on the daily chart level with price trending higher and MACD also trending higher. This is an indication that the upwards trend remains in place. I would expect to see some classic technical divergence before the end of this trend.
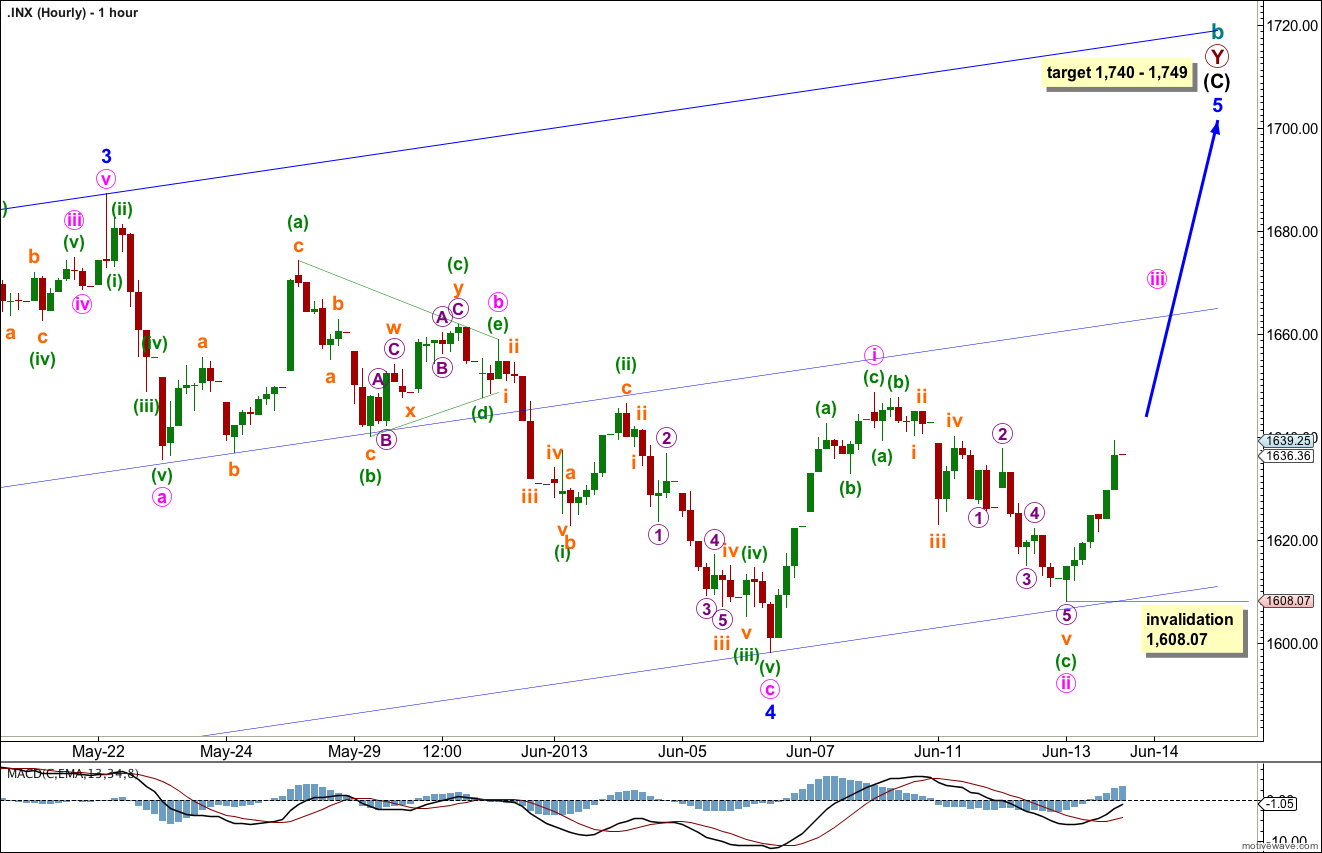
Minute wave ii moved slightly lower to find support at the lower edge of the parallel channel, as expected.
This is most likely where minute wave iii upwards has begun.
Minute wave ii is now 80% the length of minute wave i, within the typical length of 0.66 to 0.81 of the first wave.
Ratios within minute wave ii are: minuette wave (c) is now just 0.51 points short of 4.236 the length of minuette wave (a).
Ratios within minuette wave (c) are: subminuette wave iii has no Fibonacci ratio to subminuette wave i, and subminuette wave v is now just 0.46 longer than 4.236 the length of subminuette wave i.
Ratios within subminuette wave v are: micro wave 3 is 1.39 points longer than 1.618 the length of micro wave 1, and micro wave 5 1.1 points longer than equality in length with micro wave 1.
If minute wave iii unfolds as a zigzag and is longer than minute wave i in length then this diagonal is likely to be an ending expanding diagonal. That may be long enough in length to reach the target.
If, however, minute wave iii unfolds as an impulse then the diagonal may be leading and I would have to move the degree of labeling within it all down one degree.
If minute wave iii is shorter than minute wave i then the diagonal would be contracting. At that stage either the target is too high or the diagonal may again be only a leading diagonal for minute wave i, and labeling within it must be moved down one degree.
Rather than have an alternate with exactly the same labeling except for degree, I will leave it at one chart and just point out the degree may change.
It is not common to see Fibonacci ratios between waves 1, 3 and 5 of diagonals so I will not use the ratio between minute waves i and iii to calculate a target. It would have too low a probability to be of use to you.
When minuette waves (a) and (b) within minuete wave iii are complete then I will use the ratio between minuette waves (a) and (c) to calculate a target for minute wave iii to end. I cannot do this yet.
Alternatively, if the third wave of the diagonal is an impulse we may use the ratios between waves 1, 3 and 5 within it to calculate a target. If this is the case then still, I cannot do this yet.
Minute wave iii should show an increase in upwards momentum beyond that seen for minute wave i.
When minute wave iii is a completed zigzag (or impulse) then minute wave iv should overlap back into minute wave i price territory, but it may not move beyond the end of minute wave ii. The invalidation point will remain the same at 1,608.07.
Within minute wave iii minuette wave (b) may not move beyond the start of minuette wave (a). This wave count is invalidated with movement below 1,608.07.