
Last week’s analysis expected more choppy overlapping movement for a fourth wave correction to end about 14,986. Price reached lower to fall 129.57 points short of the target.
The wave count remains the same with just the one daily and one hourly chart for you. I have an extra chart which overlays a similar period from the 1970’s recession for you. There is a close relationship between these two periods and this may show us what is going to happen next, if the relationship continues to hold.
Click on the charts below to enlarge.
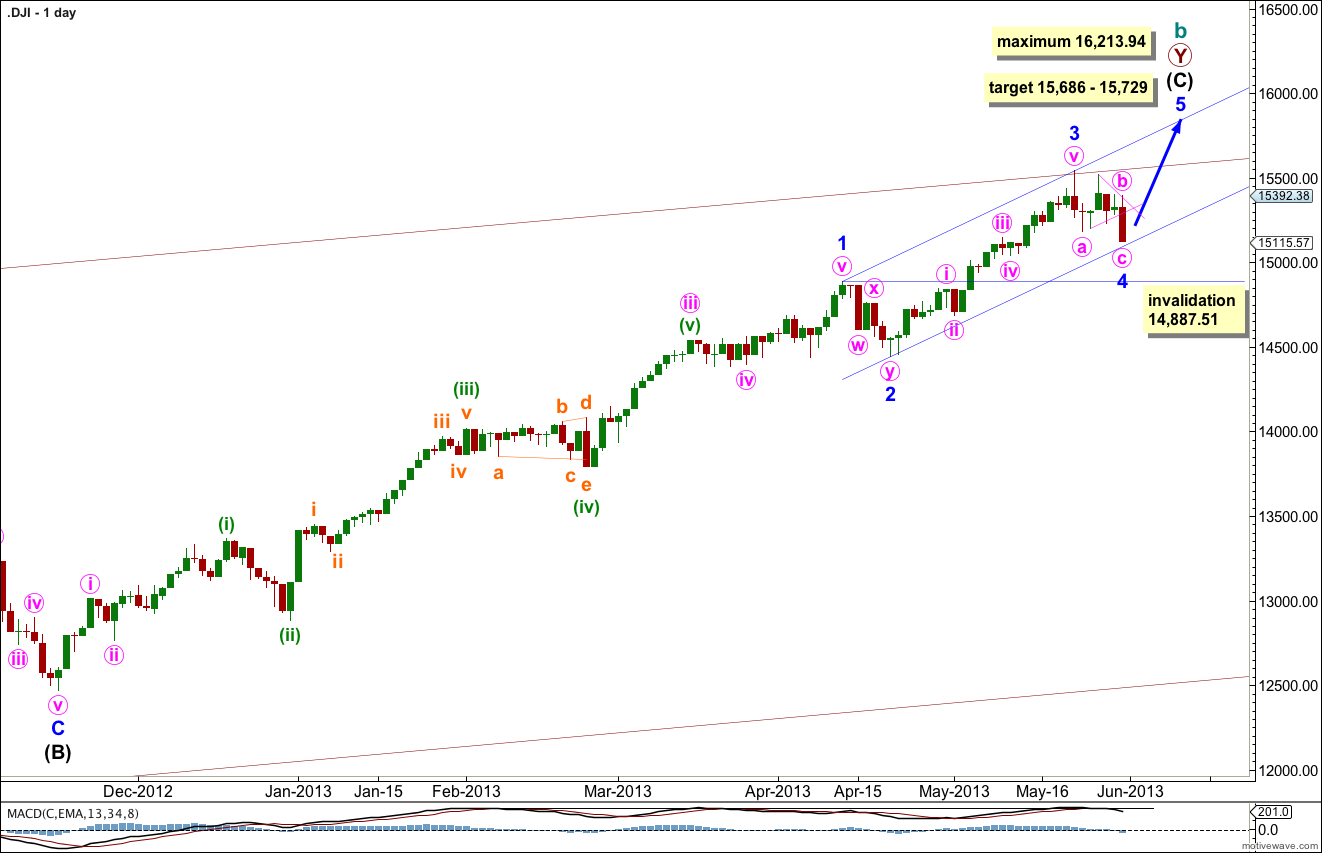
There are several possible ways to label this long upwards movement of intermediate wave (C). This wave count sees minor waves 1 through to 4 complete with the first wave extended. This interpretation sees the strongest momentum as within the third wave.
There is no Fibonacci ratio between minor waves 1 and 3. This makes it more likely there will be a Fibonacci ratio between minor wave 5 and either of 1 or 3. At 15,686 minor wave 5 would reach 0.236 the length of minor wave 1.
At 15,729 intermediate wave (C) would reach equality with intermediate wave (A).
Because minor wave 3 is shorter than minor wave 1 the upcoming minor wave 5 will be limited to no longer than equality with minor wave 3, as a third wave may never be the shortest wave. This limit is reached at 16,213.94.
Draw a channel about intermediate wave (C) using Elliott’s first technique. Draw the first trend line from the ends of minor waves 1 to 3, then place a parallel copy upon the low of minor wave 2. Expect minor wave 4 to find support about the lower edge of the channel.
The wide maroon channel is drawn about cycle wave b at the monthly chart level and copied over here to the daily chart. Upwards movement for last week found resistance at the upper maroon trend line and should continue to do so.
Minor wave 4 may not move into minor wave 1 price territory. This wave count is invalidated with movement below 14,887.51.
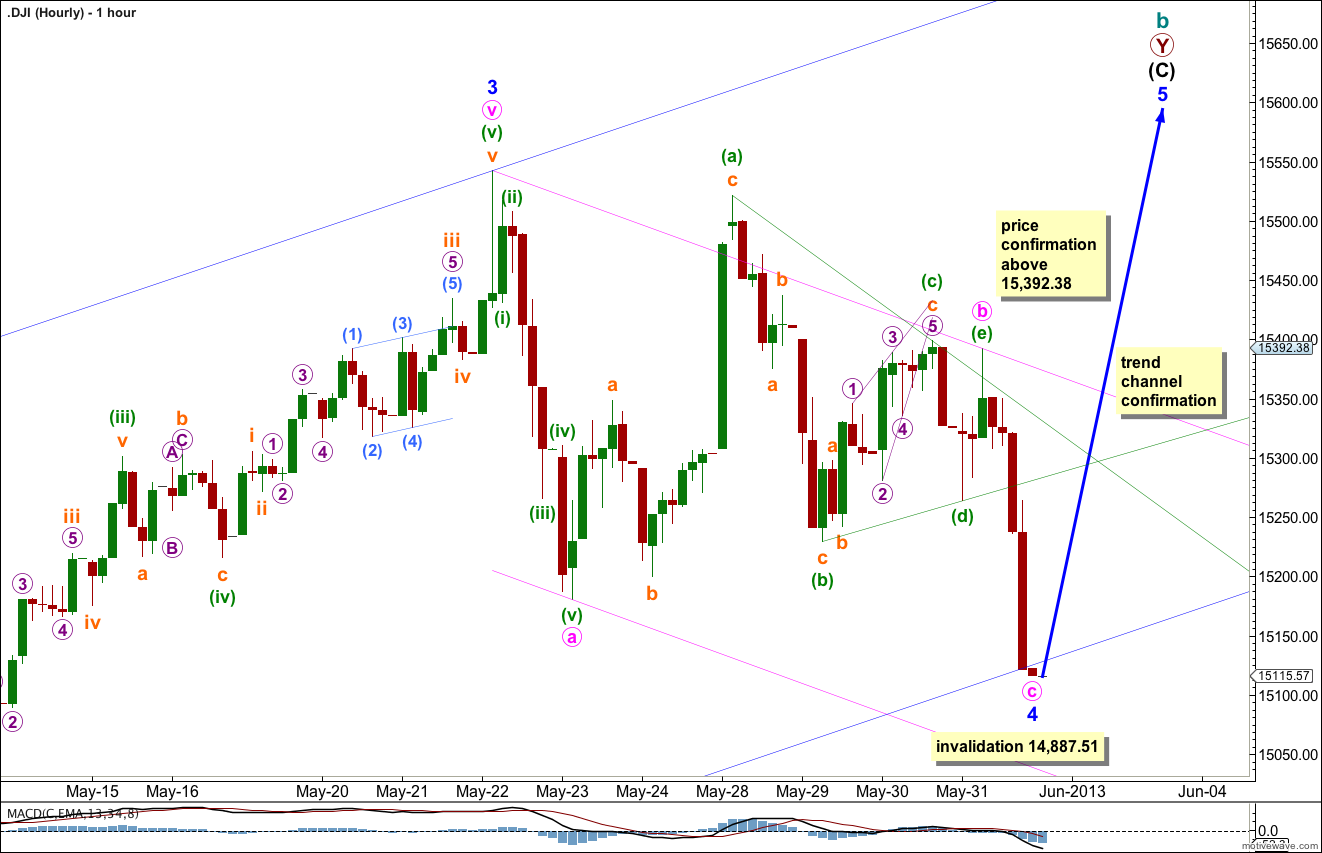
Minor wave 4 may have completed as a zigzag correction with minute wave b within it a contracting triangle.
Minor wave 2 was a double zigzag, and minor wave 4 is a single zigzag showing nice alternation. They both lasted six days.
Within minor wave 4 there is no Fibonacci ratio between minute waves a and c.
Within minute wave c there is not enough (or any) upwards movement at the end of Friday’s session to confirm that it is over. We must accept the possibility that minute wave c may continue lower. If it does a target may be about 15,030 where it would reach equality in length with minute wave a. I would expect any further downwards movement to find support at the lower edge of the parallel pink channel containing the zigzag of minor wave 4.
However, it may be that price has found support at the lower edge of the blue parallel channel copied over here from the daily chart. This may be where minor wave 5 upwards begins.
Minor wave 3 lasted three weeks so I would expect minor wave 5 to be about the same duration.
Movement above 15,392.38 cannot be a second wave correction within minute wave c and so at that stage minute wave c would have to be over.
Movement above the pink parallel channel containing minor wave 4 would provide trend channel confirmation that the correction is over and the main trend has resumed.
Extra Chart – Comparison With 1970’s Recession.
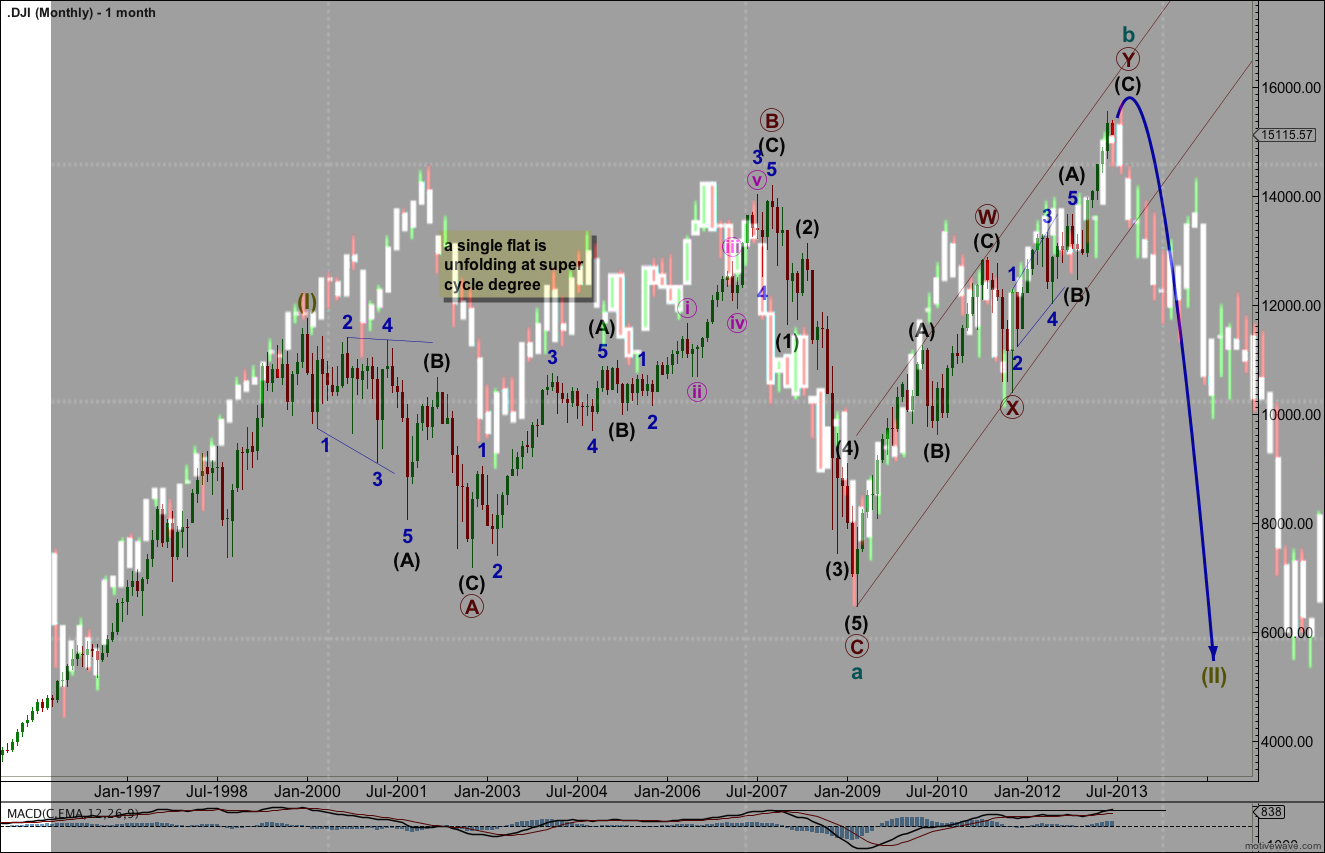
The background is my current monthly main wave count for the Dow, on which you can see my wave labels. This is the current time frame.
The darker foreground is overlaid monthly candlesticks from the 1961 to 1975. There is a remarkably close correlation.
The correlation within the recent upwards trend labeled cycle wave b for the current time frame is also close.
If this relationship continues to hold we should see a major crash ahead to lows below the end of the “credit crunch” low.