
Last analysis expected more choppy, overlapping movement. This is what has happened for the start of the new week.
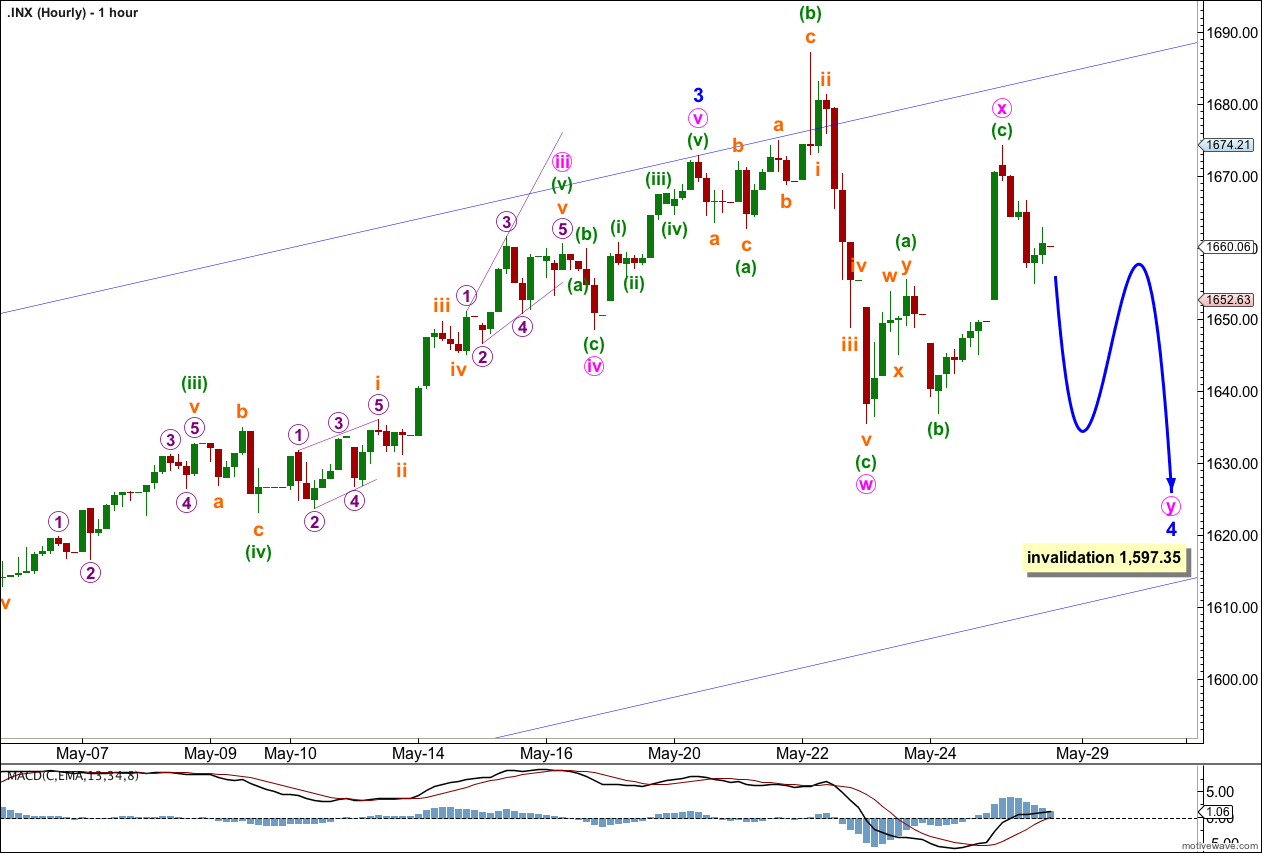
Last analysis had a short term target for a little upwards movement to start the new week to 1,657. Upwards movement exceeded this target by 17.21 points before turning downwards.
The wave count remains the same.
Click on the charts below to enlarge.
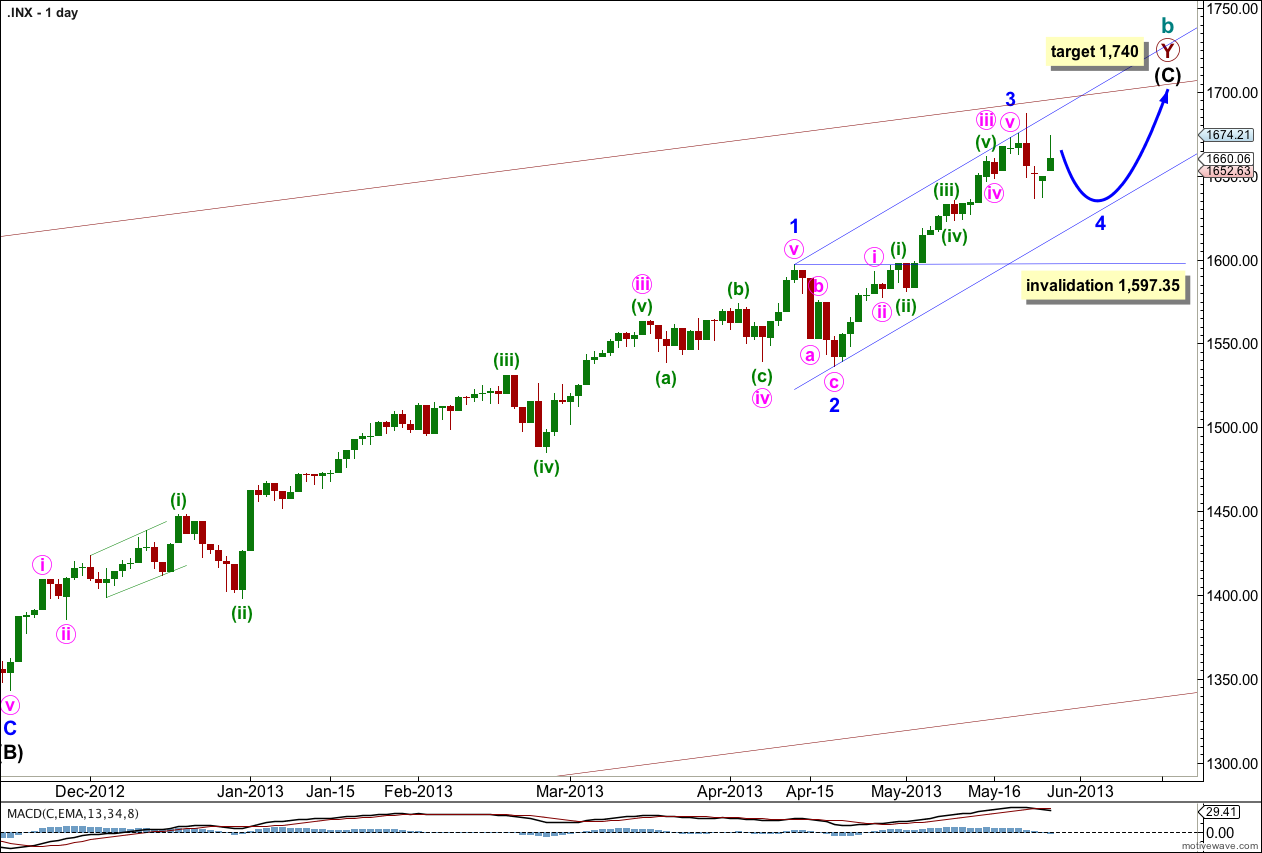
Within intermediate wave (C) minor wave 1 was extended. Minor wave 3 is showing an increase in momentum beyond that seen within minor wave 1.
Minor wave 3 may now be complete. There is no Fibonacci ratios between minor waves 3 and 1. This means it is highly likely we should see a Fibonacci ratio between minor wave 5 and either of 3 or 1.
Minor wave 3 is shorter than minor wave 1. Minor wave 5 would be limited to no longer than equality with minor wave 3 because a third wave may never be the shortest.
At 1,740 intermediate wave (C) would reach equality with the orthodox length of intermediate wave (A). When minor waves 3 and 4 within intermediate wave (C) are complete I will use calculations at minor degree to add to this target so it may change or widen to a zone.
Minor wave 4 may not move into minor wave 1 price territory. This wave count is invalidated with movement below 1,597.35.
I have redrawn the parallel channel about intermediate wave (C) today using Elliott’s first technique. Draw the first trend line from the highs of minor waves 1 to 3, then place a parallel copy upon the low of minor wave 2. Expect minor wave 4 to find support at the lower edge of this channel. The following fifth wave may end midway in the channel where it intersects with the upper maroon trend line.
The very wide maroon trend channel shown here is copied over from the monthly chart. We may find this movement ends as it finds resistance at the upper trend line.
It remains most likely that minor wave 4 is incomplete.
Minor wave 4 looks like it is unfolding as a double flat or double combination. The first structure in the double labeled minute wave w is an expanded flat correction.
The double is joined by a three in the opposite direction, a regular flat labeled minute wave x. Within minute wave x minuette wave (b) is a 93% correction of minuette wave (a), and minuette wave (c) has no Fibonacci ratio to minuette wave (a).
On the five minute and one minute charts minuette wave (c) subdivides nicely into a five wave impulse.
The purpose of double flats and double combinations is to take up time and move price sideways. We may expect minute wave y to end about the same point as minute wave w at 1,635.53. If it moves below this price point then it should find support at the lower edge of the parallel channel copied over here from the daily chart.
Minute wave y may unfold as a flat (most likely), zigzag, or triangle (least likely).
Minute wave w lasted a Fibonacci 21 hours. We should expect minute wave y to be about the same duration if it is a flat or zigzag, but it may be longer if it unfolds as a triangle.
Minor wave 4 may not move into minor wave 1 price territory. This wave count is invalidated with movement below 1,597.35.