Last analysis expected more upwards movement, which is what we have seen for Monday’s session. The short term target is still days away.
The wave count remains the same.
Click on the charts below to enlarge.
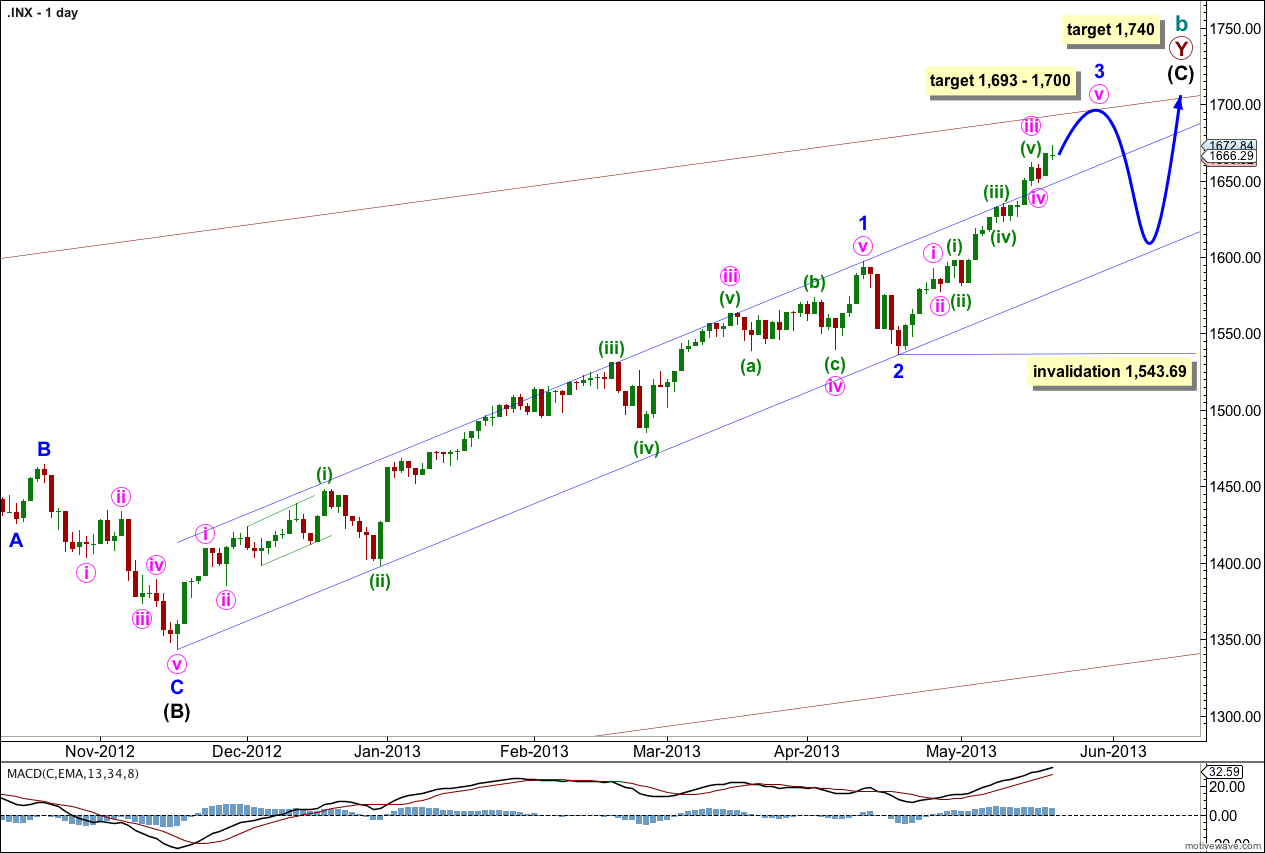
Within intermediate wave (C) minor wave 1 was extended. Minor wave 3 is showing an increase in momentum beyond that seen within minor wave 1.
So far within minor wave 3 minute waves i and iii may be complete. Minute wave iii has no Fibonacci ratio to minute wave i.
Minute wave iv was over at the end of Thursday’s session and minute wave v began on Friday.
This wave count requires an end to minor waves 3, 4 and 5. Minor wave 3 is unlikely to be extended also and would most likely be 0.618 the length of minor wave 1. This is achieved at 1,693. At 1,700 minute wave v within minor wave 3 would reach 0.618 the length of minute wave iii.
Minor wave 5 would most likely be equal in length to minor wave 3, or it may be 0.618 the length of minor wave 3. If minor wave 3 is shorter than minor wave 1 then minor wave 5 would be limited to no longer than equality with minor wave 3 because a third wave may never be the shortest.
At 1,740 intermediate wave (C) would reach equality with the orthodox length of intermediate wave (A). When minor waves 3 and 4 within intermediate wave (C) are complete I will use calculations at minor degree to add to this target so it may change or widen to a zone.
Within minor wave 3 if we move the degree of labeling all down one degree and are yet to see a minute wave ii correction then minute wave ii may not move beyond the start of minute wave i. This wave count is invalidated with movement below 1,543.69.
The very wide maroon trend channel shown here is copied over from the monthly chart. We may find this movement ends as it finds resistance at the upper trend line.
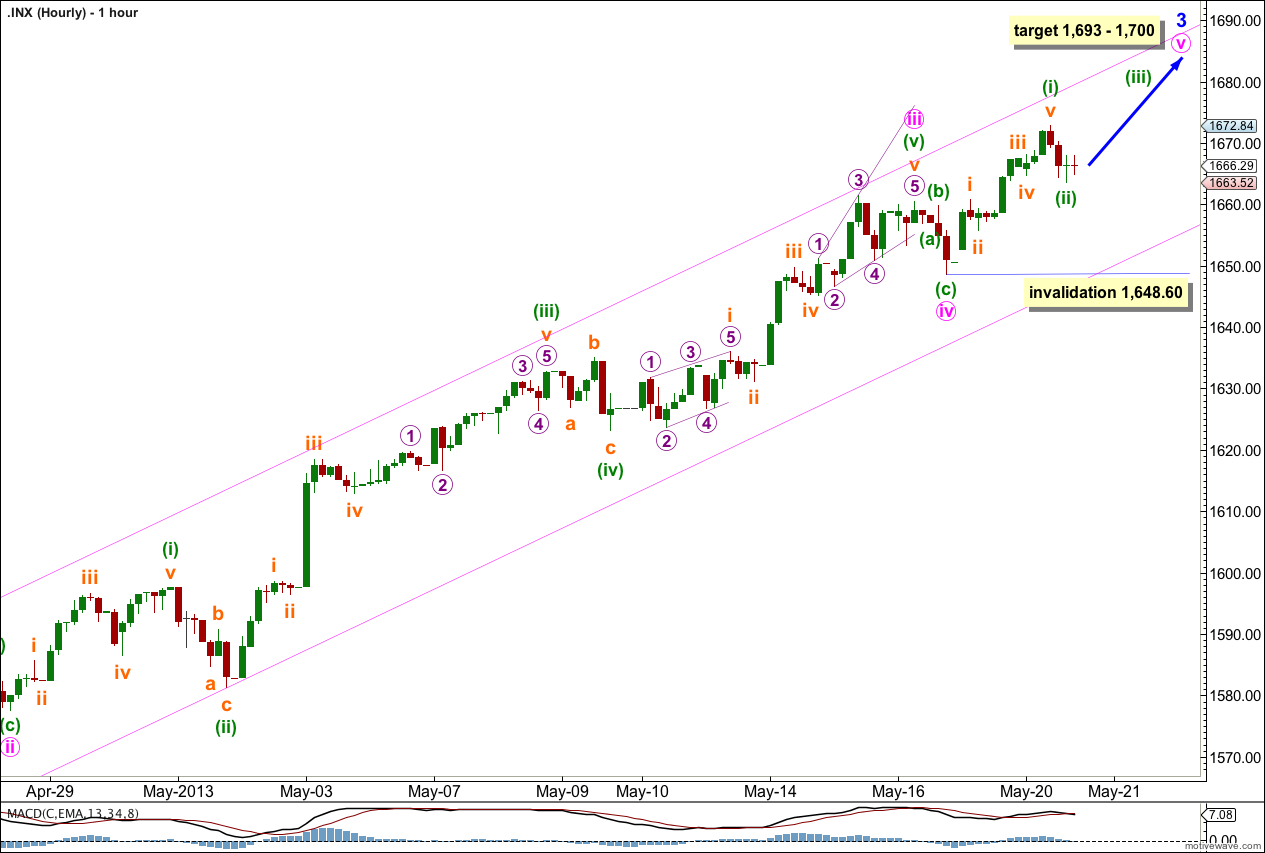
I have moved the degree of labeling within minute wave v down one degree. We have probably only seen the end of minuette wave (i) during Monday’s session.
On the five minute and one minute charts minuette wave (i) subdivides nicely into a five wave impulse, and this looks correct on the hourly chart too. For this reason I will discard the alternate from last analysis as that required a three wave structure upwards.
If we moved the degree of labeling within minute wave v up one degree it would be possible to see minor wave 3 as complete. However, there would be no adequate Fibonacci ratios between minute waves i, iii and v within minor wave 3, which is unusual. This reduces the probability of this possible alternate, and for this reason I’m not seriously considering it. I expect minute wave v is incomplete.
At 1,700 minute wave v would reach 0.618 the length of minute wave iii. At 1,693 minor wave 3 would reach 0.618 the length of minor wave 1.
Within minute wave v minuette wave (ii) may not move beyond the start of minuette wave (i). This wave count is invalidated with movement below 1,648.60.
From the five minute chart if we see movement below 1,663.52 then we would know that minute wave (ii) is incomplete and is continuing as a double zigzag. Unfortunately, there is no upper price point which would confirm minuette wave (ii) is over as it may continue further sideways as a flat which may include a new high for wave B within it.


“We are raising our S&P 500 dividend estimates Goldman raises S&P 500 targets through 2015 and index return forecasts for 2013 through
2015.
We expect S&P 500 index will rise by 5% from the current level to 1,750 by year-end 2013, advance by 9% to 1,900 in 2014, and climb by 10% to 2100 in 2015.” http://blogs.marketwatch.com/thetell/2013/05/21/goldman-raises-sp-500-targets-through-2015/
It looks like their targets are based upon fundamental analysis, which is mutually exclusive to Elliott wave.
Hello Lara,
I can see you reasoning for this wave count. It makes good sense to get the fibonacci 1:1 relationship for intermediate C with intermediate A, as well as as sychronise monetum rise with MACD. I can see good elliott channels converging toward your 1740 target as well.
If however, the MACD momentum rise in intermediate C is related to a wave 5 blowoff rather than moving from a a very extended minor wave one that leads into a minor wave 3, would you have labelled the count as you have. In other words, if MACD momentum is not used to synchonise with a wave 3 could you see the SPX in a minor wave 5 right now, rather than as you have it towards the end of minor wave 3? An alternative like this would be good if you considered it viable.
I don’t see blowoffs like that in the S&P 500. I do see it in Oil and Gold, but not stocks.
This does not mean that it cannot happen however. I’ll cover this at the end of today’s video with a monthly chart and Motive Wave.
Thanks for looking at the potential for a 5th wave blow off in momentum. Historically on the SPX it does not seem to be that regular. The QE is different this time so maybe things differ this time.
The elliott channels converging toward 1740 at cycle, primary and intermediate degree provide good indication your target has a lot going for it.