
Last week’s analysis expected more upwards movement from the Dow to a short term target at 15,083 – 15,108. Price reached 37 points above the target for the week.
The wave count remains the same.
Click on the charts below to enlarge.
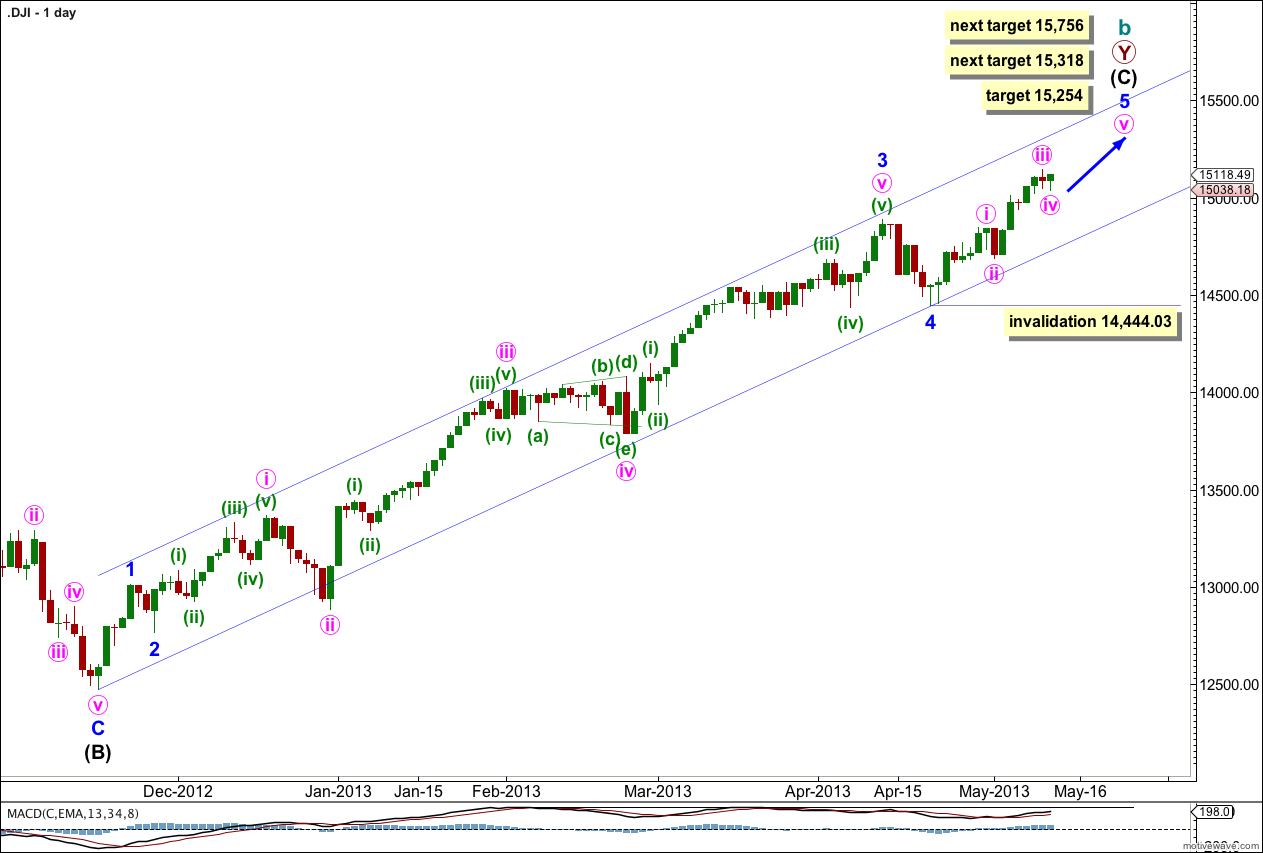
There are several possible ways to label this long upwards movement of intermediate wave (C). This wave count sees minor waves 3 and 4 complete.
There is no Fibonacci ratios between minor waves 1 and 3. This makes it more likely there will be a Fibonacci ratio between minor wave 5 and either of 1 or 3. There are several possible Fibonacci ratios. At 15,254 minor wave 5 would reach 0.382 the length minor wave 3. At 15,283 minute wave v within minor wave 5 would reach 0.618 the length of minute wave i. This gives us a 29 point target zone for the first possible target for upwards movement to end.
If price keeps rising through this first target zone, or if when it gets there the structure is incomplete and requires further upwards movement, then we may use the next Fibonacci ratio.
At 15,318 minor wave 5 would reach 1.618 the length of minor wave 1.
The next target is at 15,756 where minor wave 5 would reach 0.618 the length of minor wave 3.
The channel drawn here is a best fit. Draw the first trend line from the start of intermediate wave (C) to the low of minor wave 4, then place a parallel copy upon the high of minute wave (iii) within minor wave 3. Minor wave 5 may end midway within the channel, or should find resistance at the upper edge. When the channel is clearly breached by downwards movement we shall have an indication of a possible trend change.
At this stage we have some divergence with price trending higher and MACD trending lower. If this divergence continues on the daily chart this wave count will expect a trend change in coming weeks, maybe about two to four weeks away.
Within minor wave 5 no second wave correction may move beyond the start of its first wave. This wave count is invalidated with movement below 14,444.03.
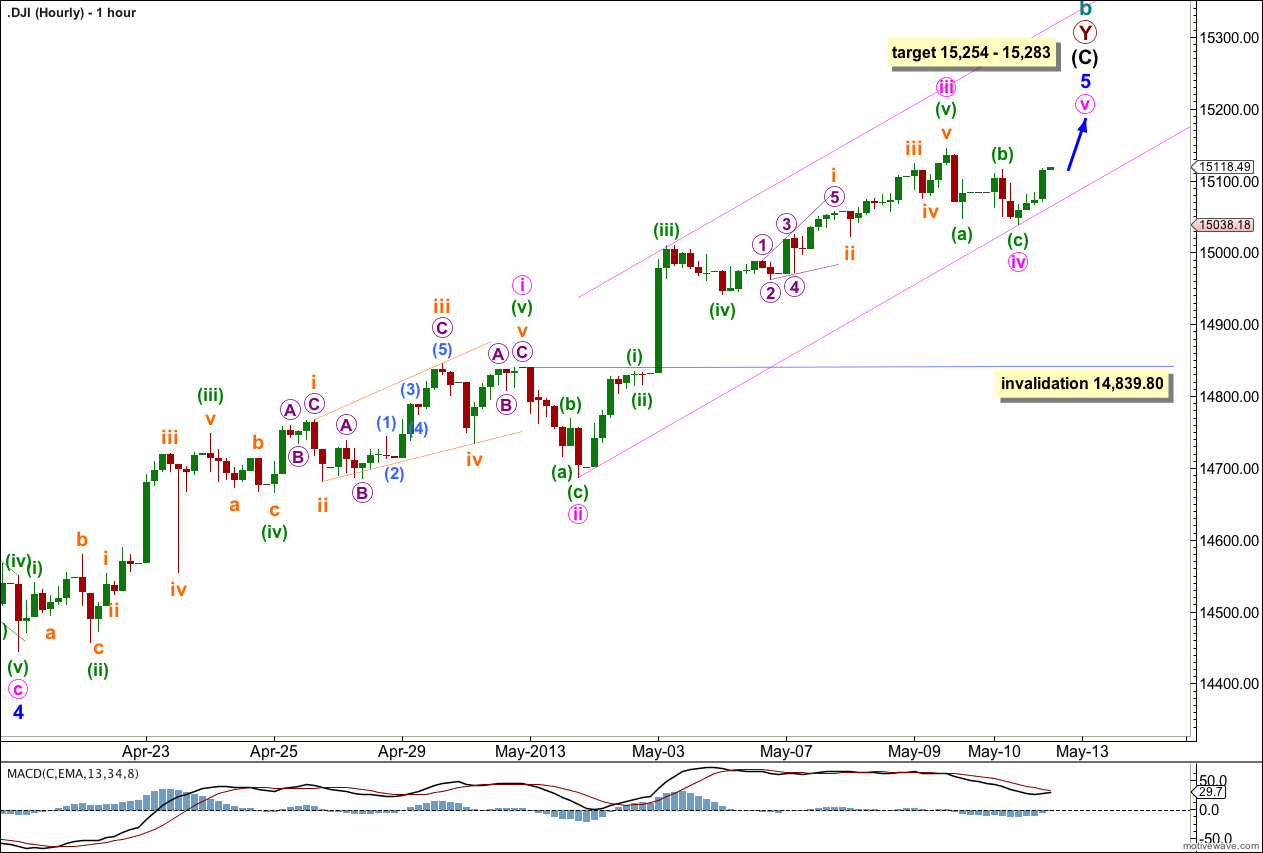
Within minor wave 5 minute wave iii may have ended at the end of the week. There is no Fibonacci ratio between minute waves i and iii.
Ratios within minute wave iii are: minuette wave (iii) has no Fibonacci ratio to minuette wave (i), and minuette wave (v) is 9.69 points longer than equality with minuette wave (iii).
Ratios within minuette wave (v) extension are: subminuette wave iii has no Fibonacci ratio to subminuette wave i, and subminuette wave v is just 2.62 longer than 0.618 the length of subminuette wave iii.
Within minute wave iv zigzag there is no Fibonacci ratio between minuette waves (a) and (c).
Draw a best fit channel about minor wave 5. Draw the first trend line from the lows of minute waves ii to iv, then place a parallel copy upon the high of minuette wave (iii) within minute wave iii. Expect price to find support and resistance on these trend lines while minor wave 5 continues higher.
At this stage is it not possible to be certain that minute wave iv is over. If we move the degree of labeling within it down one degree we may have seen only minuette wave (a) complete as a zigzag. Minute wave iv may continue further as a flat correction, combination, double zigzag or a triangle. If it does continue further it may not move into minute wave i price territory. This wave count is invalidated with movement below 14,839.80.