
Yesterday’s analysis expected a little upwards movement to begin the session to a short term target at 1,634 to 1,637 before some downwards movement. Price reached higher during the start of the session, to 1,635.01, and thereafter moved lower which was expected.
The wave count remains the same.
Click on the charts below to enlarge.
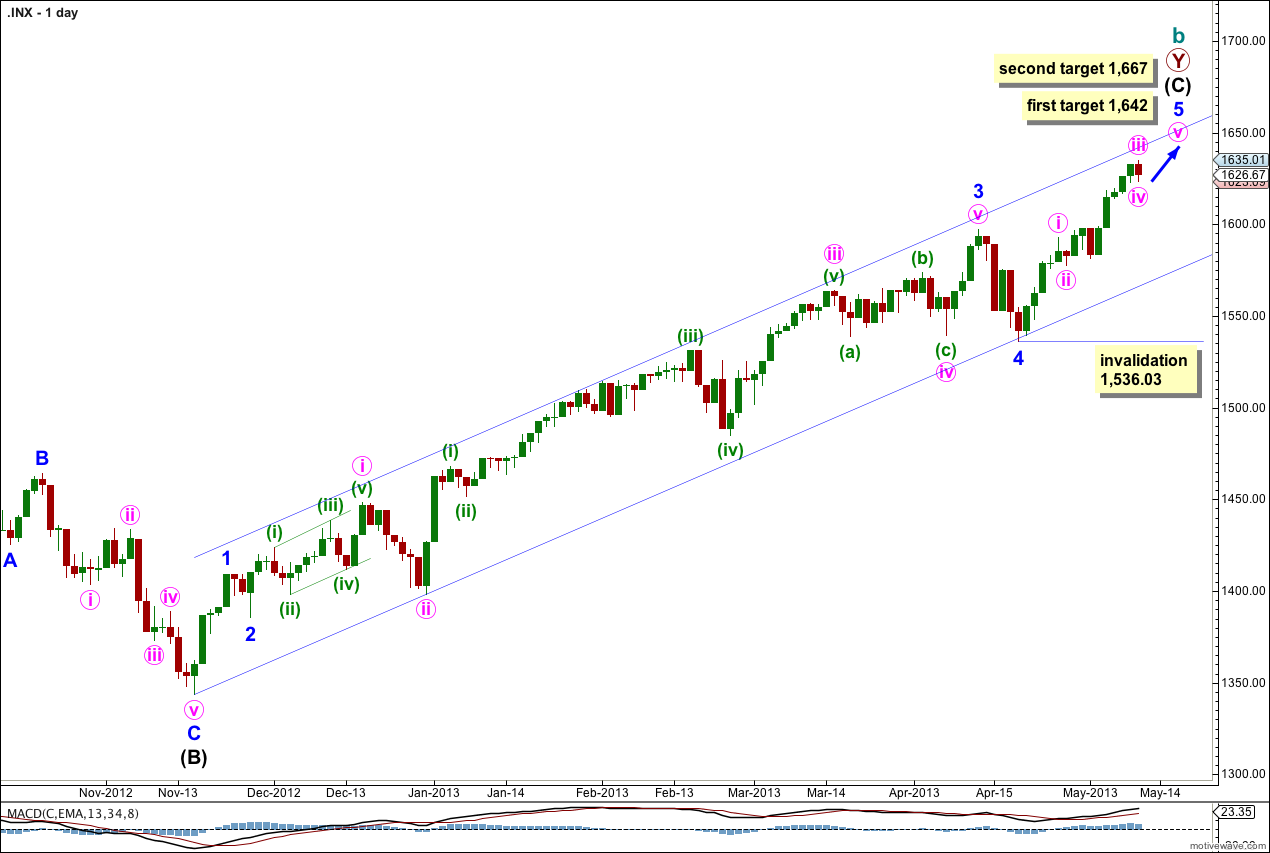
This trend is not over and price should continue to move higher for maybe about another one to three weeks.
Draw a channel about intermediate wave (C) here on the daily chart. Draw the first trend line from the start of intermediate wave (C) to the low of minute wave iii within minor wave 3. Place a parallel copy to contain all this upwards movement. So far this channel shows very closely where price is finding support and resistance and should continue to do so.
The wave count within minor wave 3 fits with MACD as an indicator of momentum. The strongest piece of upwards movement within intermediate wave (C) corresponds to the middle of a third wave.
Within intermediate wave (C) minor wave 4 is over and minor wave 5 is underway. Because there is no Fibonacci ratio between minor waves 1 and 3 I would expect to see a ratio for minor wave 5.
Minor wave 5 has passed equality with minor wave 1 and its structure is incomplete. The next target is at 1,642 where minor wave 5 would reach 1.618 the length of minor wave 1. If price continues upwards through this target the next target is at 1,667 where minor wave 5 would reach 0.618 the length of minor wave 3.
Within minor wave 5 no second wave correction may move beyond the start of its first wave. This wave count is invalidated with movement below 1,536.03.
At this stage minor wave 5 has lasted 15 days. It if takes another six days it may last a Fibonacci 21. Please note: Fibonacci time relationships are not as reliable as Fibonacci price relationships, this is a guideline only.
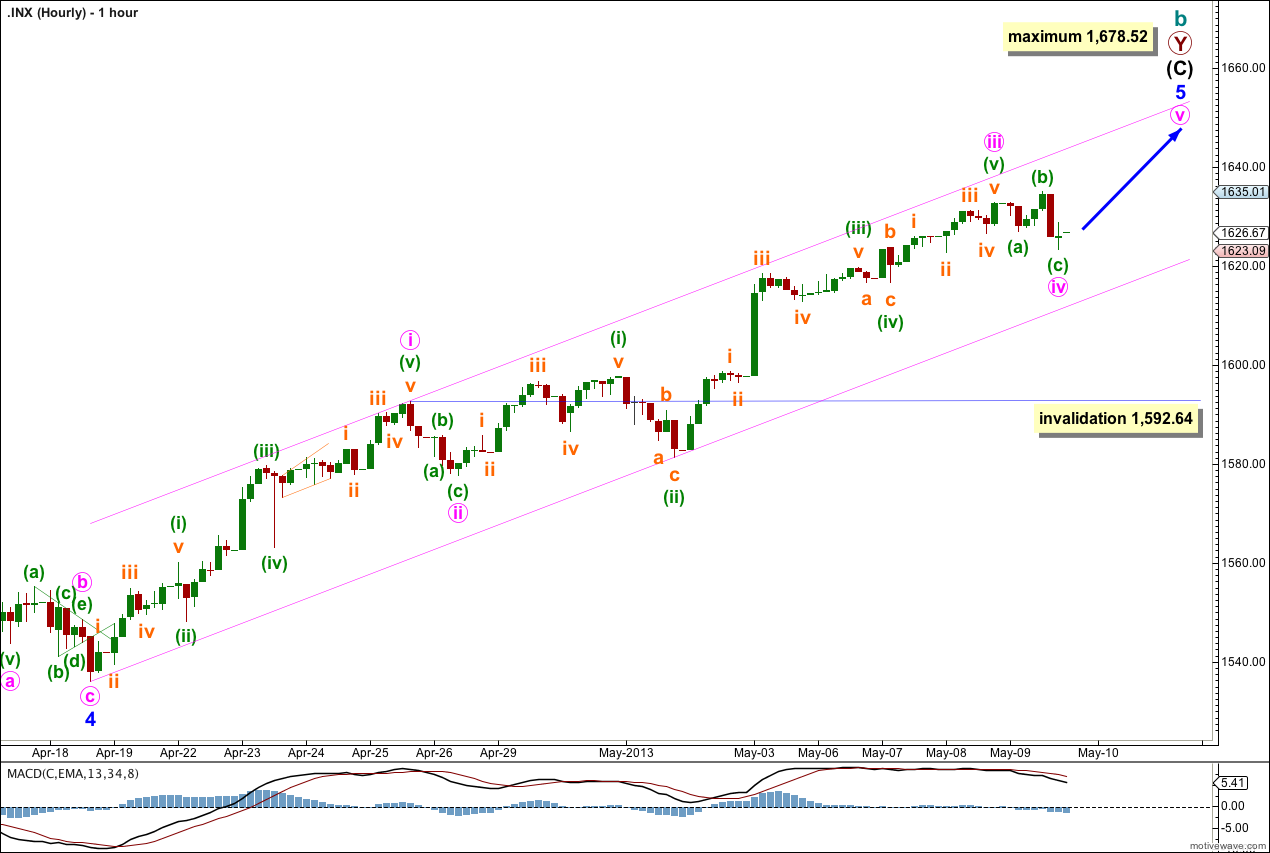
Minute wave iii did not move higher and remains 1.39 points short of equality with minute wave i. This is important because a third wave may never be the shortest wave and this limits minute wave v to no longer than equality with minute wave iii at 1,678.52.
Ratios within minute wave i are: minuette wave (iii) has no Fibonacci ratio to minuette wave (i), and minuette wave (v) is 1.78 points short of equality with minuette wave (iii).
Ratios within minute wave iii are: minuette wave (iii) has no Fibonacci ratio to minuette wave (i), and minuette wave (v) is 1.44 points longer than 0.382 the length of minuette wave (iii).
There is a Fibonacci ratio between minute waves i and iii also. Minute wave iii is 1.39 points short of equality with minute wave i.
Minute wave iv may be over as a single flat correction lasting one day, or it may continue further sideways as a double flat, double combination or triangle. If it does it may not move into minute wave i price territory. This wave count is invalidated with movement below 1,592.64.
Unfortunately, if minute wave iv continues further as a combination, running triangle or expanding triangle it may make a new price high. There is no upwards price point which confirms an end to minute wave iv and the commencement of minute wave v. A careful analysis of the next wave upwards on the five minute chart is required to determine if the correction is over. If the next upwards wave is a five wave structure to a new high then minute wave iv would be complete. If the next wave upwards is a three wave structure then minute wave iv may be continuing.
Alternate Hourly Wave Count.
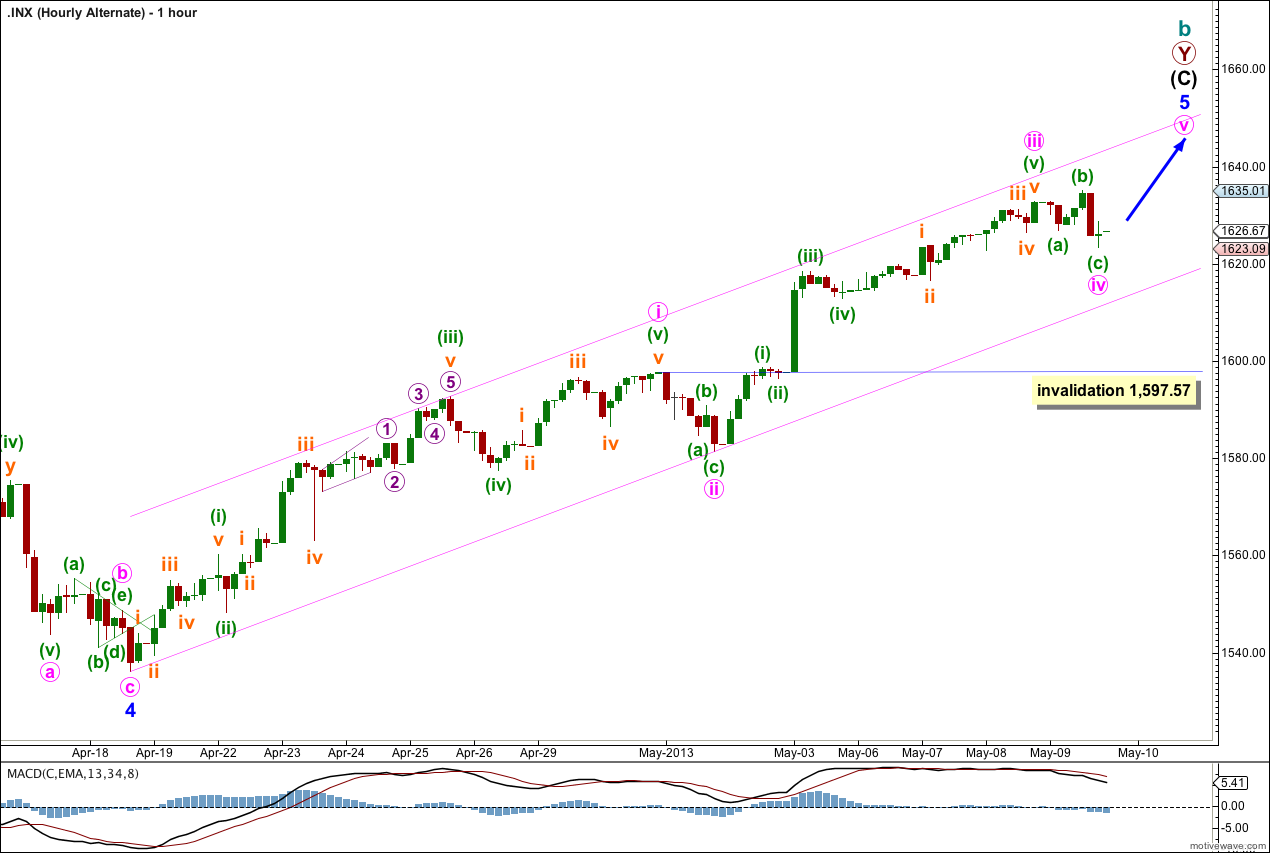
In response to a members query I would like to take a look at this possibility.
On the daily chart it looks like minute wave iii should have its end at 1,597.57 instead of lower down at 1,592.64 where I have it on the main hourly wave count and the daily chart.
This is a valid wave count. However, it has a lower probability for the following reasons:
Within minute wave i there are no Fibonacci ratios between minuette waves (i), (iii) and (v).
Also, within minute wave iii there are no Fibonacci ratios between minuette waves (i), (iii) and (v).
There no Fibonacci ratio between minute waves iii and i.
However, this wave count is valid, does look better considering the daily chart, and fits nicely with MACD. I will keep considering it as an alternate but I will only publish it again if it proves itself to be correct.