
The main wave count from last analysis expected further upwards movement towards a target at 1,619. Price moved higher to 1,618.44 for Friday’s session.
The alternate hourly wave count had expected downwards movement for Friday. Although this wave count is not technically invalidated it has entirely the wrong look now and will be discarded. The main wave count is explaining price action nicely.
Click on the charts below to enlarge.
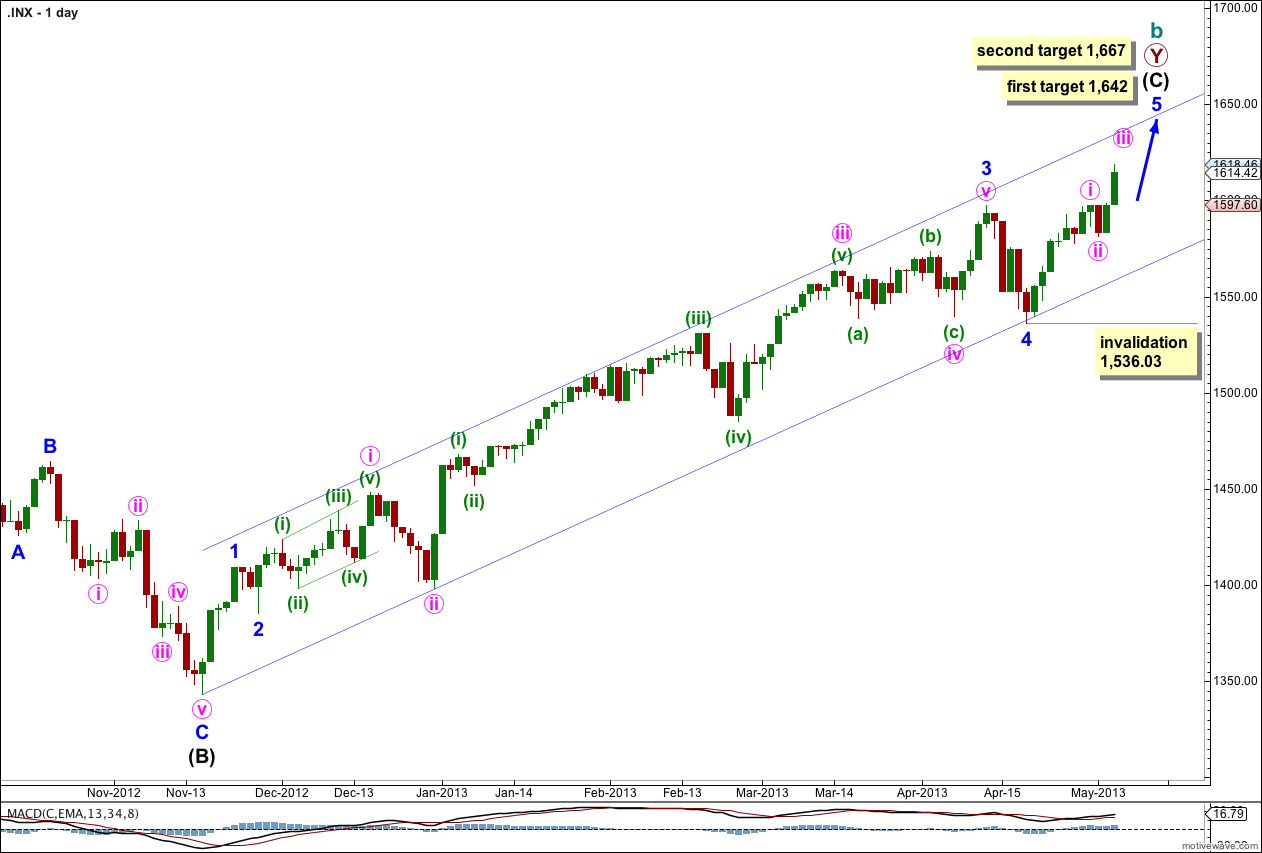
This trend is not over and price should continue to move higher for maybe about another two to four weeks.
Draw a channel about intermediate wave (C) here on the daily chart. Draw the first trend line from the start of intermediate wave (C) to the low of minute wave iii within minor wave 3. Place a parallel copy to contain all this upwards movement. So far this channel shows very closely where price is finding support and resistance and should continue to do so.
The wave count within minor wave 3 too fits with MACD as an indicator of momentum. The strongest piece of upwards movement within intermediate wave (C) corresponds to the middle of a third wave.
Within intermediate wave (C) minor wave 4 is over and minor wave 5 is underway. Because there is no Fibonacci ratio between minor waves 1 and 3 I would expect to see a ratio for minor wave 5.
Minor wave 5 has passed equality with minor wave 1 and its structure is incomplete. The next target is at 1,642 where minor wave 5 would reach 1.618 the length of minor wave 1. If price continues upwards through this target the next target is at 1,667 where minor wave 5 would reach 0.618 the length of minor wave 3.
Within minor wave 5 no second wave correction may move beyond the start of its first wave. This wave count is invalidated with movement below 1,536.03.
At this stage minor wave 5 has lasted 11 days. If it comes to a speedy end in just another two days it would last a Fibonacci 13. Otherwise, and maybe more likely, it may take yet another ten days in total (two weeks) to last a Fibonacci 21.
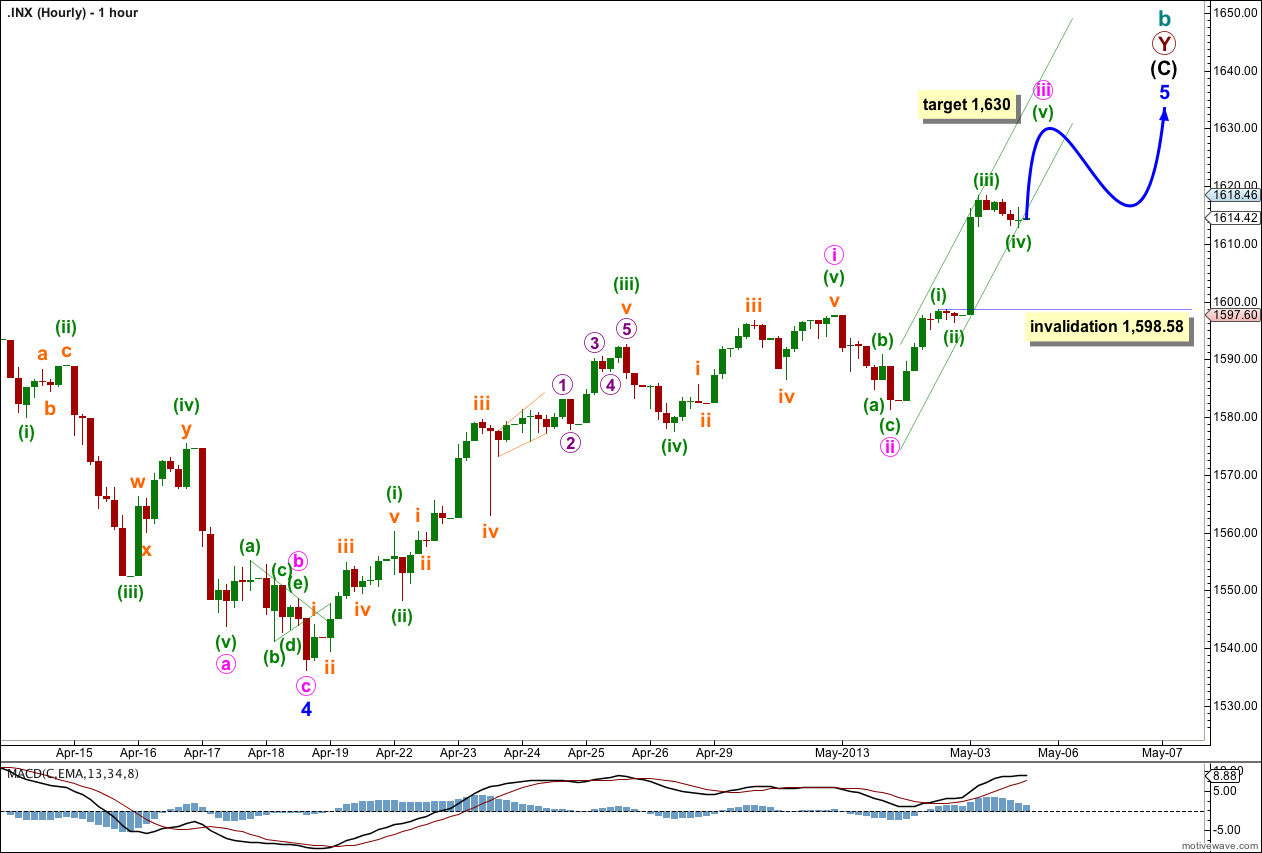
Friday saw upwards momentum increase which is exactly what a third wave should do. The middle of this third wave may have unfolded during Friday’s session.
The structure of minute wave iii is incomplete. It should continue to move higher next week.
Within minute wave iii minuette wave (iii) is longer than equality with minuette wave (i) but there is no adequate Fibonacci ratio between these waves. I would expect to see a Fibonacci ratio between minuette wave (v) and either of minuette waves (i) or (iii). At 1,630 minuette wave (v) would reach equality in length with minuette wave (i).
On the five minute chart minuette wave (iv) subdivides well into a completed three wave zigzag. It may be over here, or this may be subminuette wave a within a flat for minuette wave (iv). If minuette wave (iv) moves lower the target will have to move correspondingly lower.
Minuette wave (iv) may not move into minuette wave (i) price territory. This wave count is invalidated with movement below 1,598.58.
Draw a small best fit parallel channel about minute wave iii. Minuette wave (v) may remain contained within this small channel. When this channel is clearly breached by downwards movement then minute wave iii would be likely to be over and minute wave iv should be underway. At that stage move the invalidation point to the high of minute wave i at 1,597.57.