
The main wave count expected upwards movement for Tuesday’s session with an increase in momentum which is what we have seen. However, the short term target at 1,587 was not reached with price falling 7.42 points short of the target.
The wave counts remain the same. The main wave count again has increased slightly in probability, with the alternate decreasing in probability.
Click on the charts below to enlarge.
Main Wave Count.
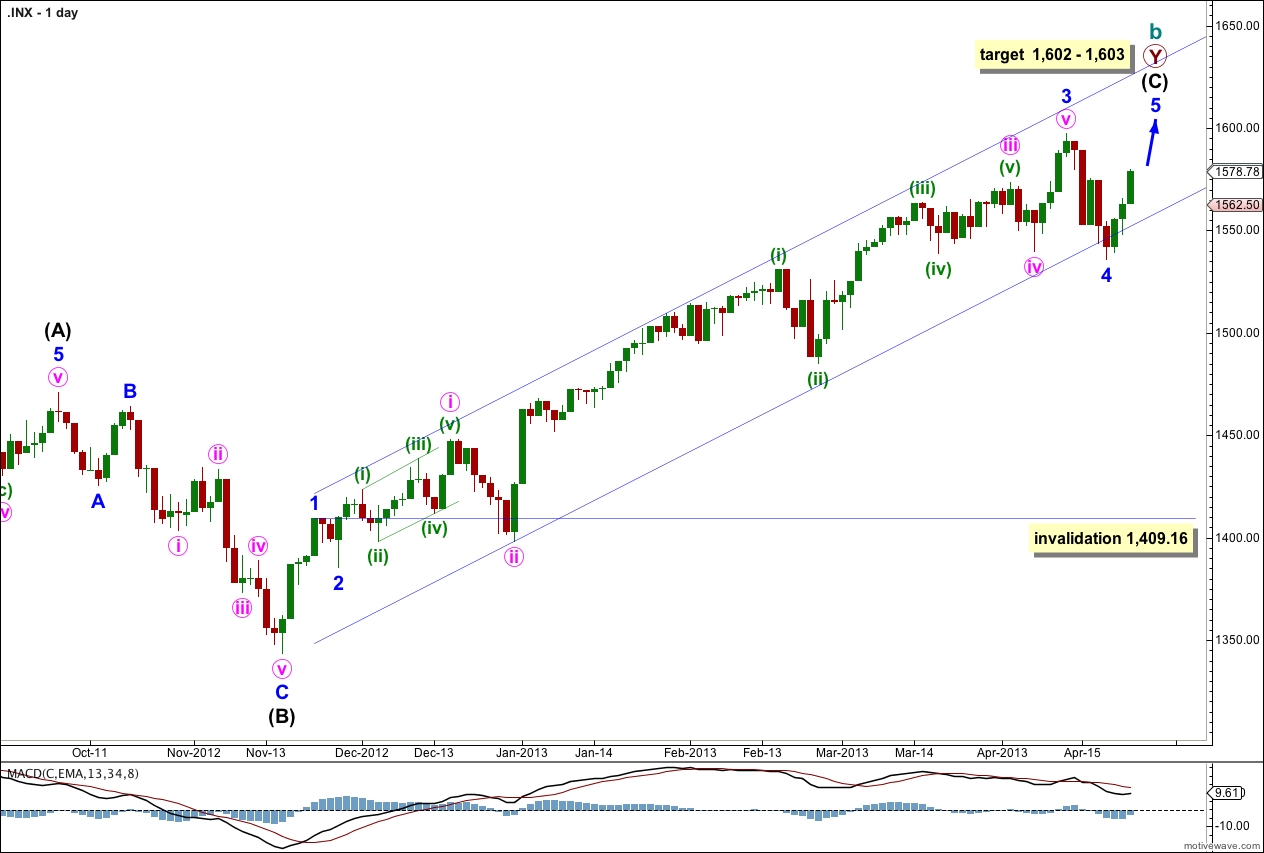
This is my main wave count because we should always assume the trend remains the same, until proven otherwise. We do not have sufficient confirmation of a trend change so we should assume we shall see more upwards movement.
Although the alternate wave count has a channel breach this main wave count does not. The channel is only overshot. I want to see a clear channel breach of this channel also before I have confidence in a trend change.
The channel drawn here is a conservative best fit. Draw the first trend line from the highs of minor waves 1 to 3 and push it upwards to enclose all upwards movement. Place a parallel copy upon the low of minute wave ii within minor wave 3. Minor wave 4 should find some support about the lower edge of this channel.
Minor wave 4 may now be complete; it subdivides into a three on the hourly chart. Alternatively, we may move the degree of labeling within it down one degree and only minute wave a within minor wave 4 may have completed. I expect it is most likely to be complete because it is in proportion to other corrections within intermediate wave (C) and it has lasted a Fibonacci 5 days.
There is no Fibonacci ratio between minor waves 1 and 3. This means it is more likely we shall see a Fibonacci ratio between minor wave 5 and either of 1 or 3. At 1,603 minor wave 5 would reach equality with minor wave 1. This is the most likely Fibonacci relationship for minor wave 5 so this target has a good probability.
If it continues further minor wave 4 may not move into minor wave 1 price territory. This wave count is invalidated with movement below 1,409.16.
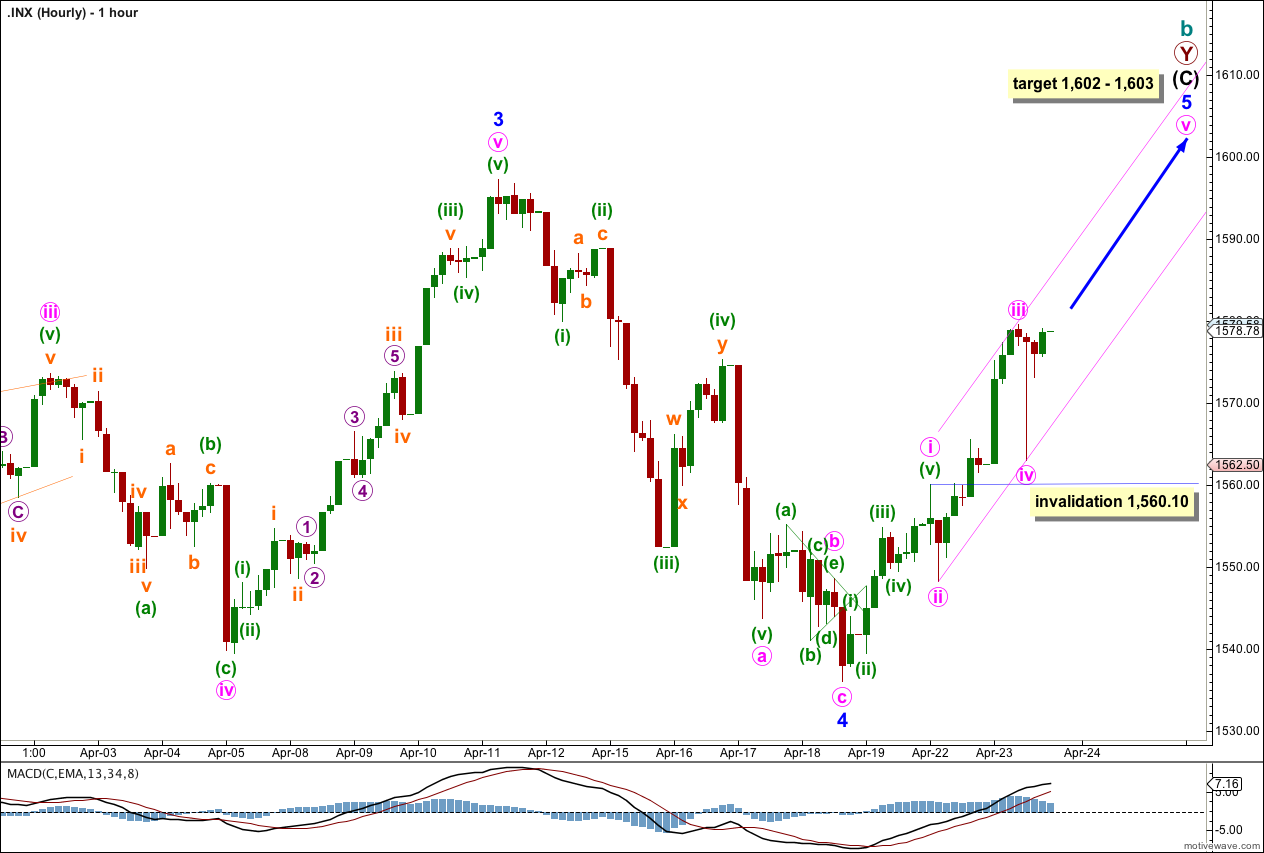
Price moved higher and an increase in momentum suggests a third wave may have completed.
The brevity of the sharp spike downwards labeled minute wave iv means we must accept that this may have been only minuette wave (a) within minute wave iv. It may continue further sideways as a flat or combination. If it does it has very little further room for downwards movement and so a continuation should see mostly sideways movement.
The depth of minute wave iv however suggests that it is likely to be over as a very brief sharp deep zigzag. There is good alternation between minute wave ii as a relatively shallow zigzag (49%) and minute wave iv a relatively deep zigzag (53%). On the five minute chart, although both structures are zigzags within them, the A and C waves differ considerably in proportion.
There is no Fibonacci ratio between minute waves i and iii. This makes it more likely we shall see a Fibonacci ratio between minute wave v and either of i or iii.
At 1,602 minute wave v would reach 1.618 the length of minute wave i. Because this target coincides nicely with the target at one degree higher it has a good probability.
We may now draw a channel about minor wave 5. Draw the first trend line from the lows of minute waves ii to iv, then place a parallel copy upxon the high of minute wave iii. Expect minute wave v to end midway within the channel, or to find resistance about the upper edge. When this channel is clearly breached by downwards movement then the upwards impulse will be complete.
If minute wave iv were to continue further sideways it may not move into minute wave i price territory. This wave count is invalidated with movement below 1,560.1.
Alternate Wave Count.
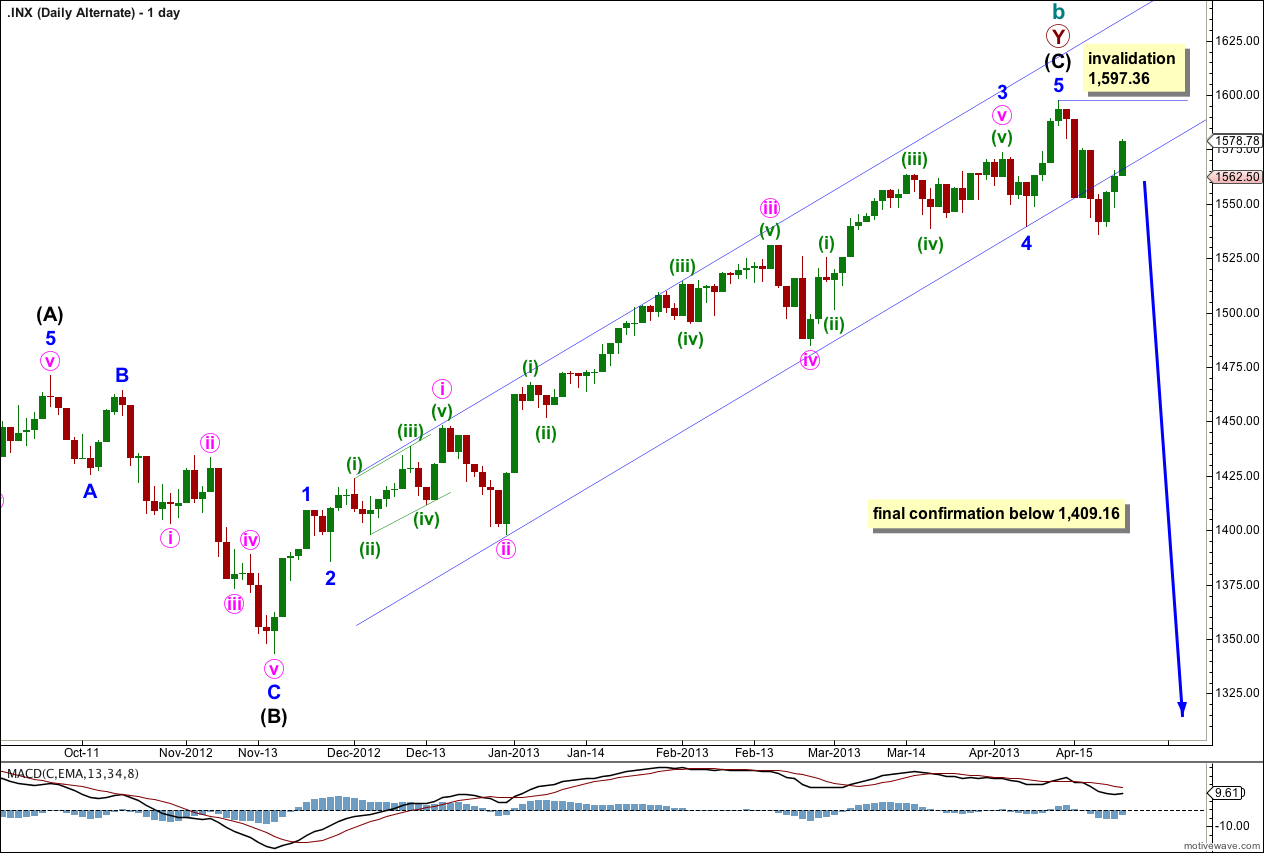
It is again possible that we have seen a trend change, but at this early stage we do not have enough confirmation. There is a hanging man candlestick pattern, but this is an indicator only and not a reversal pattern.
This wave count agrees with MACD as an indicator of momentum. The strongest piece of movement is minuette wave (iii) within minute wave iii within minor wave 3, the very middle of the third wave.
The channel drawn here is a conservative best fit. Draw the first trend line from the low of minute wave ii within minor wave 3 to the low of minor wave 4, then place a parallel copy on the high of minute wave i within minor wave 3. This channel has been breached, but it is possible to redraw the channel (as on the main daily chart) to see candlesticks for the last three days as just an overshoot and not a breach. I want to see both channels clearly breached to have any confidence in this wave count.
Final confirmation would come with invalidation of the main wave count with price movement below 1,409.16. At that stage we may have confidence that the S&P 500 should be in a new downwards trend to last one to several years and take price substantially below 666.76.
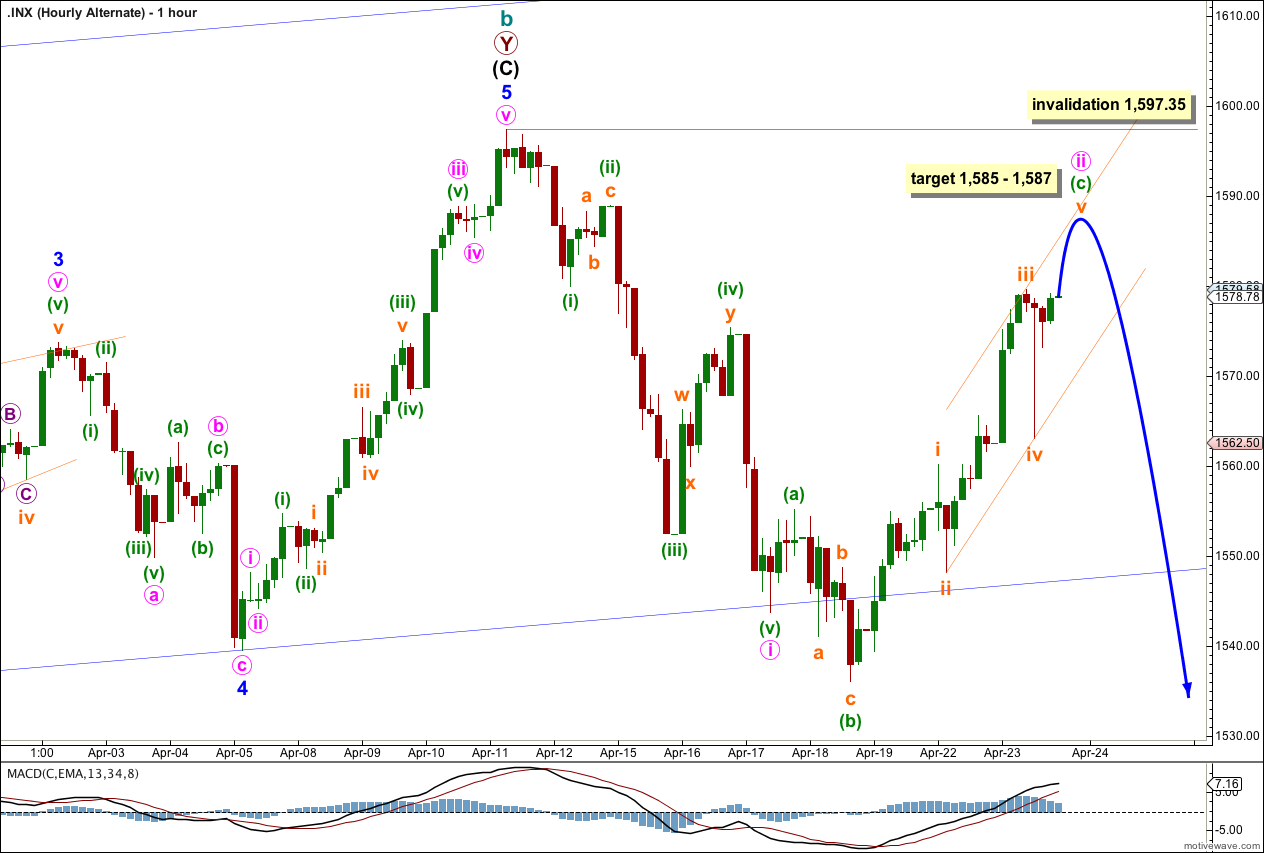
I have adjusted the wave count within this upwards movement to be the same as the main wave count. For this alternate upwards movement is minuette wave (c) within an expanded flat correction for minute wave ii.
At 1,585 minuette wave (c) would reach 4.236 the length of minuette wave (a). At 1,587 subminuette wave v would reach equality in length with subminuette wave i. This gives us a two point target zone for some more upwards movement.
On the five minute chart the structure within subminuette wave v is incomplete and requires further upwards movement.
For this alternate wave count minute wave ii may not move beyond the start of minute wave i. This wave count is invalidated with movement above 1,597.35.
Draw a channel about this upwards movement in the same was as described for the main wave count. Expect upwards movement to end midway within the channel, or to find resistance at the upper edge. When the channel is breached by downwards movement this alternate wave count expects a strong third wave down. If price does not move above 1,597.35 and this wave count remains valid we may have a surprisingly strong downwards movement ahead of us. We shall see.