
Yesterday’s analysis expected some upwards movement before price turned to make a new low. We did not see any upwards movement, but we did see some sideways movement before price turned lower.
The wave counts are the same. Although the alternate now has a channel breach I would want to see the channel on the main wave count also breached to have any confidence in a trend change.
Click on the charts below to enlarge.
Main Wave Count.
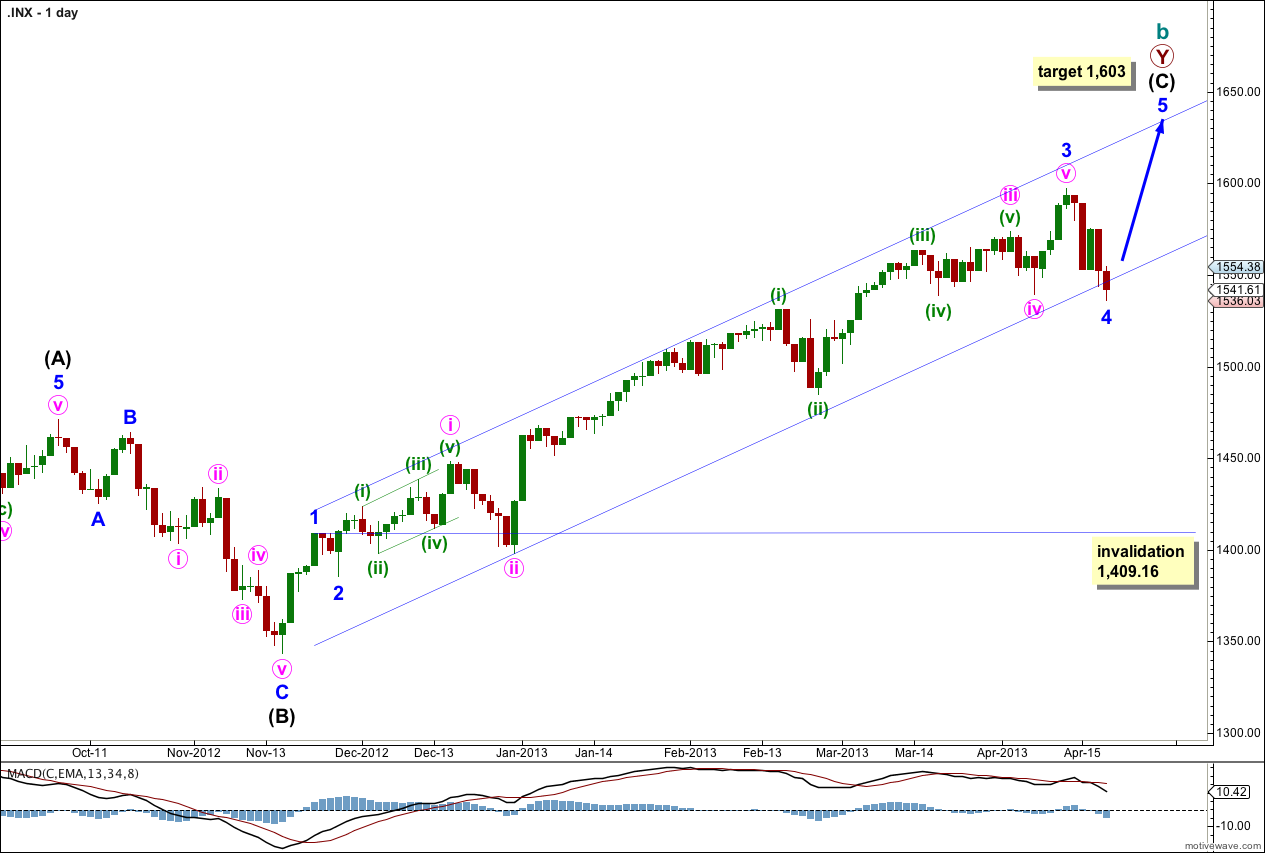
This is my main wave count because we should always assume the trend remains the same, until proven otherwise. We do not have confirmation of a trend change so we should assume we shall see more upwards movement.
Although the alternate wave count has a channel breach this main wave count does not. The channel is only overshot. I want to see a clear channel breach of this channel also before I have confidence in a trend change.
The channel drawn here is a conservative best fit. Draw the first trend line from the highs of minor waves 1 to 3 and push it upwards to enclose all upwards movement. Place a parallel copy upon the low of minute wave ii within minor wave 3. Minor wave 4 should find some support about the lower edge of this channel.
Minor wave 4 may now be complete, it subdivides into a three on the hourly chart. Alternatively we may move the degree of labeling within it down one degree and only minute wave a within minor wave 4 may have completed. I expect it is most likely to be complete because it is in proportion to other corrections within intermediate wave (C) and it has lasted a Fibonacci 5 days.
There is no Fibonacci ratio between minor waves 1 and 3. This means it is more likely we shall see a Fibonacci ratio between minor wave 5 and either of 1 or 3. At 1,603 minor wave 5 would reach equality with minor wave 1. This is the most likely Fibonacci relationship for minor wave 5 so this target has a good probability.
If it continues further minor wave 4 may not move into minor wave 1 price territory. This wave count is invalidated with movement below 1,409.16.
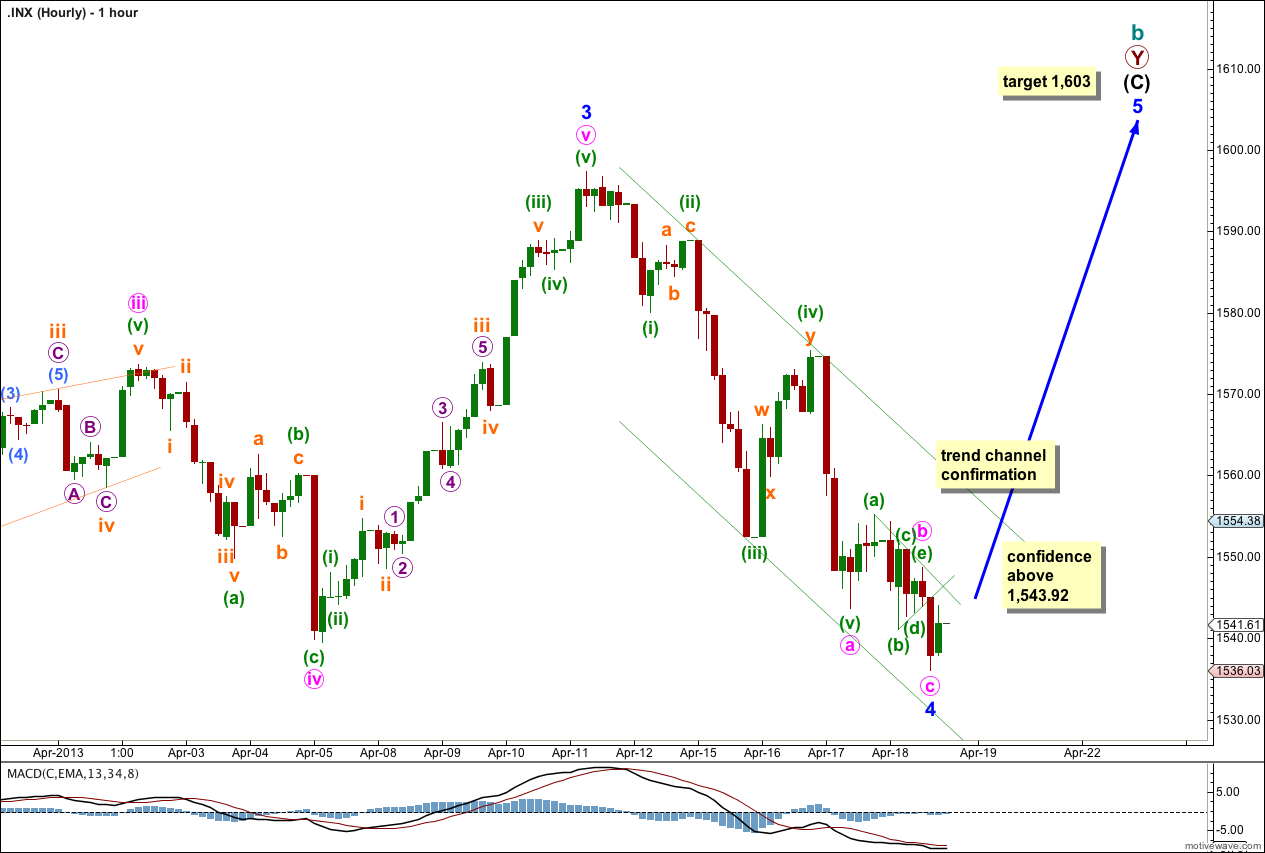
So far downwards movement subdivides into a three wave structure. We did not see the expected upwards movement for minute wave b. Price moved sideways to form a small contracting triangle for minute wave b.
Within minute wave a there are no Fibonacci ratios between minuette waves (i), (iii) and (v).
Within minor wave 4 minute wave c is just 0.04 points short of 0.236 the length of minute wave a.
We should draw a channel about this downwards movement for minor wave 4. This channel is a best fit. When this channel is breached by upwards movement then we shall have some confirmation that minor wave 4 is complete and minor wave 5 is underway.
At this early stage however it is possible that minute wave c within minor wave 4 may yet move lower. When price moves above 1,548.65 this possibility will be extremely unlikely. At that stage we may have some more confidence in the target.
Alternate Wave Count.
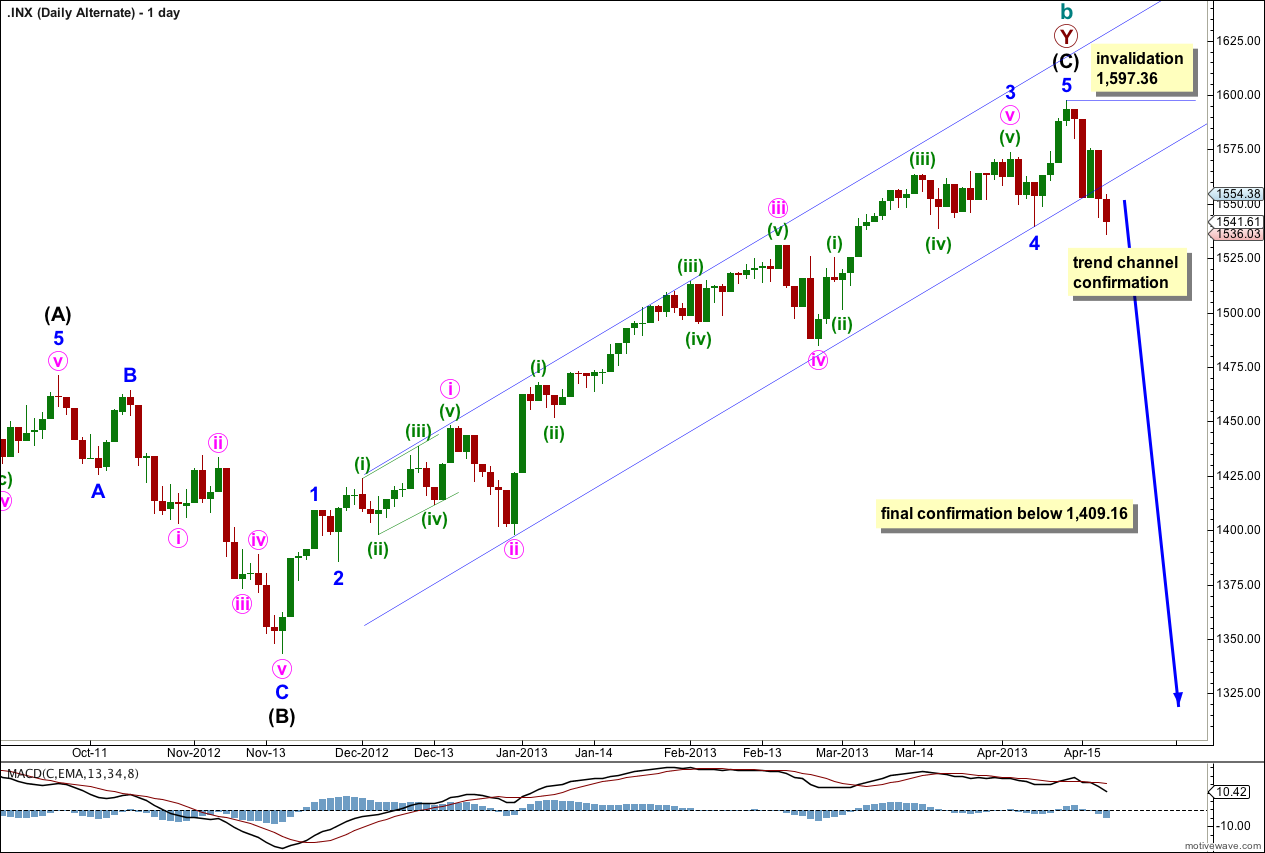
It is again possible that we have seen a trend change, but at this early stage we do not have enough confirmation. There is a hanging man candlestick pattern, but this is an indicator only and not a reversal pattern.
This wave count agrees with MACD as an indicator of momentum. The strongest piece of movement is minuette wave (iii) within minute wave iii within minor wave 3, the very middle of the third wave.
The channel drawn here is a conservative best fit. Draw the first trend line from the low of minute wave ii within minor wave 3 to the low of minor wave 4, then place a parallel copy on the high of minute wave i within minor wave 3. This channel has been breached, but it is possible to redraw the channel (as on the main daily chart) to see yesterday’s candlestick as just an overshoot and not a breach.
Final confirmation would come with invalidation of the main wave count with price movement below 1,409.16. At that stage we may have confidence that the S&P 500 should be in a new downwards trend to last one to several years and take price substantially below 666.76.
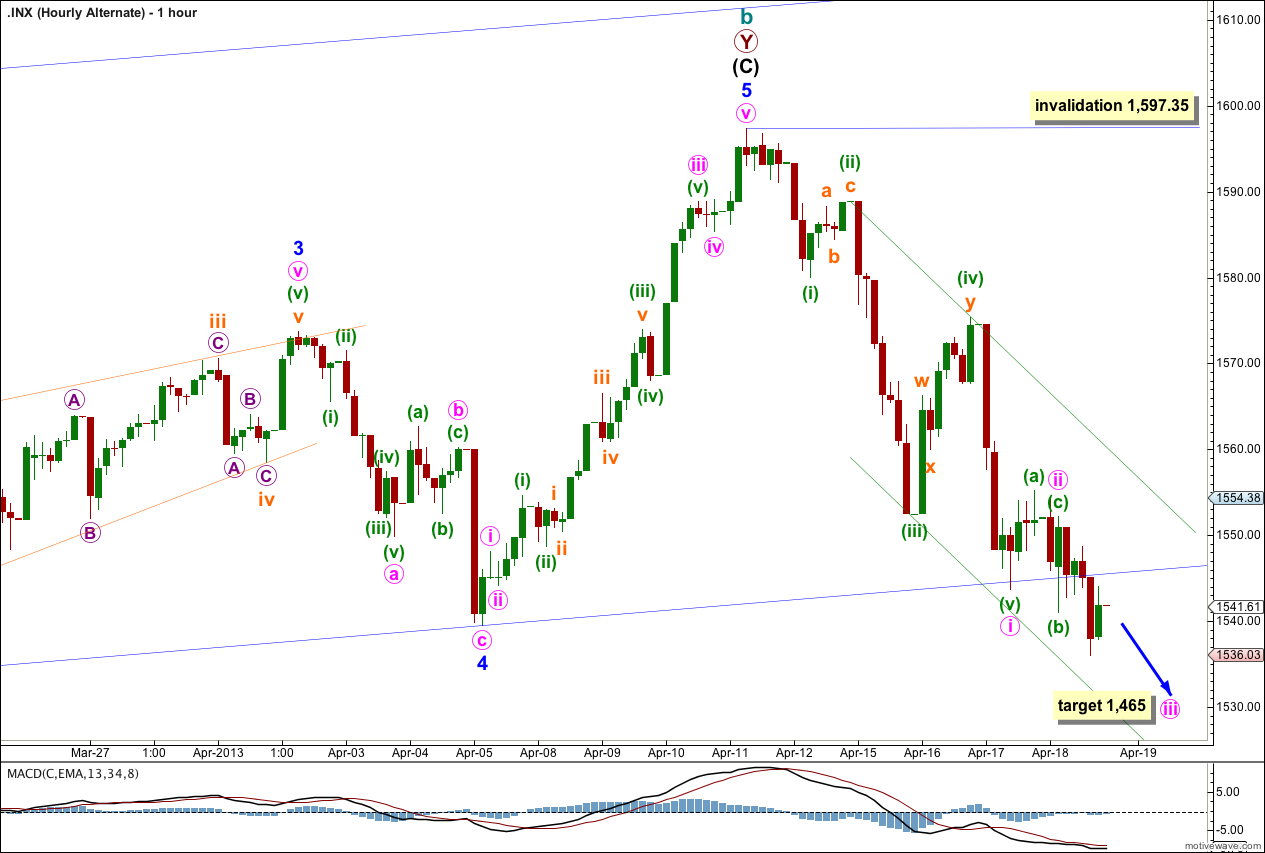
Within the sideways movement for Thursday’s session a running flat for minute wave ii can be seen on the five minute chart.
Within minute wave ii minuette wave (a) subdivides into a three, minuette wave (b) subdivides into a three and is a 161.5% correction of minuette wave (a), and minuette wave (c) subdivides into a five and is just 0.34 points short of equality with minuette wave (a).
However, running flats are rare structures. They occur when the momentum of the main trend is strong enough to pull the correction in the same direction as the main trend. In this instance the downwards movement following the end of this possible running flat does not seem to exhibit strong downwards momentum; it is not convincing enough for me to be comfortable in labeling minuete wave ii as a running flat.
If we see an increase in downwards momentum tomorrow then this alternate may redeem itself and start to make more sense.
At 1,465 minute wave iii would reach 1.618 the length of minute wave i.
Within this new downwards trend no second wave correction may move beyond the start of its first wave. This alternate is firmly invalidated with movement above 1,597.35.