
Last week’s analysis expected gold to move lower to a short term target at 1,533 before turning upwards for a correction. Price moved slightly lower but failed to get close to the target, moving only down to 1,540.24 before turning higher. With movement above 1,589.90 this upwards movement cannot be a fourth wave correction and so I have adjusted the wave count.
Click on the charts below to enlarge.
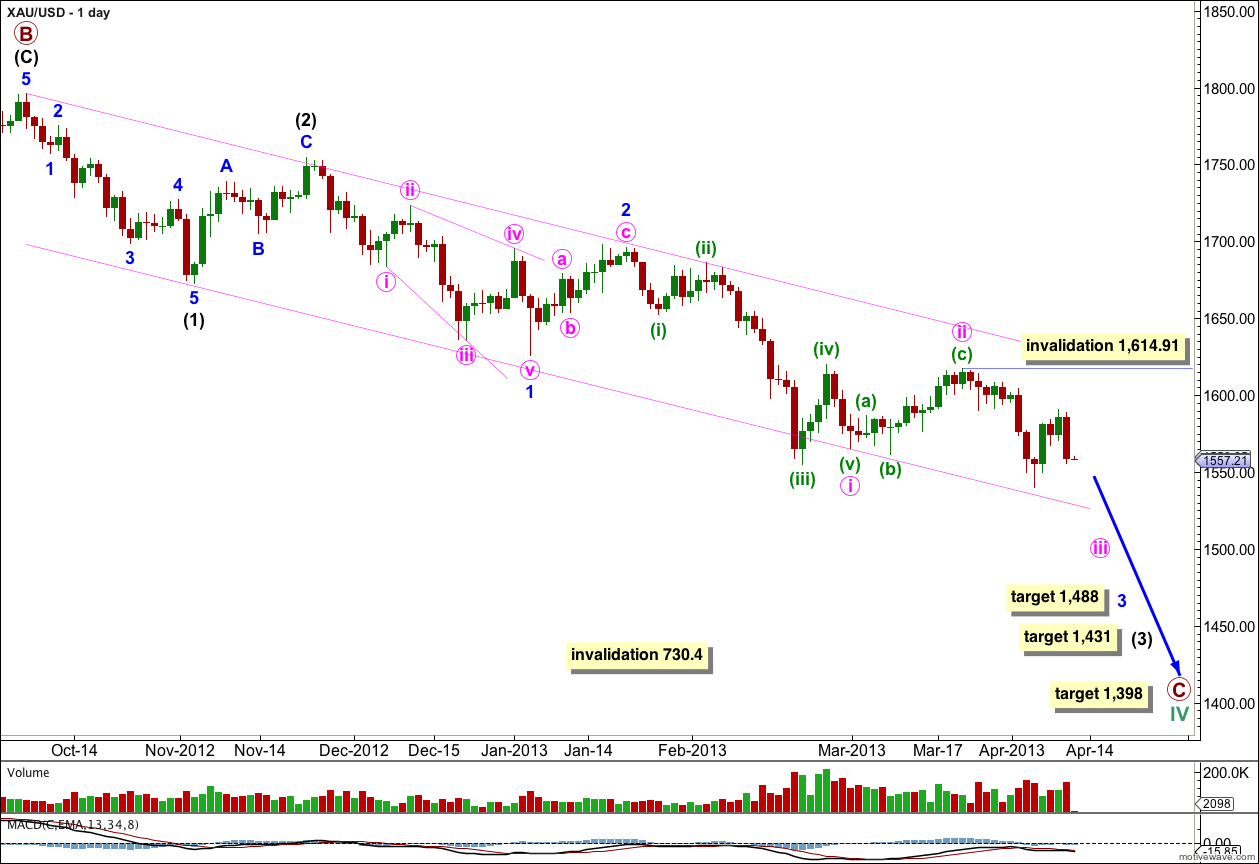
This daily chart focuses on the new downwards trend of primary wave C.
Within primary wave C intermediate waves (1) and (2) are complete. Intermediate wave (3) has begun. Within intermediate wave (3) minor waves 1 and 2 are complete and minor wave 3 is underway.
Within minor wave 3 minute wave i is complete and minute wave ii is either complete as a single zigzag (main hourly wave count) or is half way done as a double combination or double zigzag (alternate hourly wave count).
At 1,488 minor wave 3 would reach 1.618 the length of minor wave 1. This target is at least a couple of weeks away.
At 1,431 intermediate wave (3) would reach 2.618 the length of intermediate wave (1). This target is a few weeks away.
At 1,398 primary wave C would reach equality in length with primary wave A. This target is still weeks to months away.
Within minute wave iii no second wave correction may move beyond the start of its first wave. This wave count is invalidated at minute degree with movement above 1,614.91.
The parallel channel drawn here is a best fit. Minute wave iii is very likely to break through support of the lower edge.
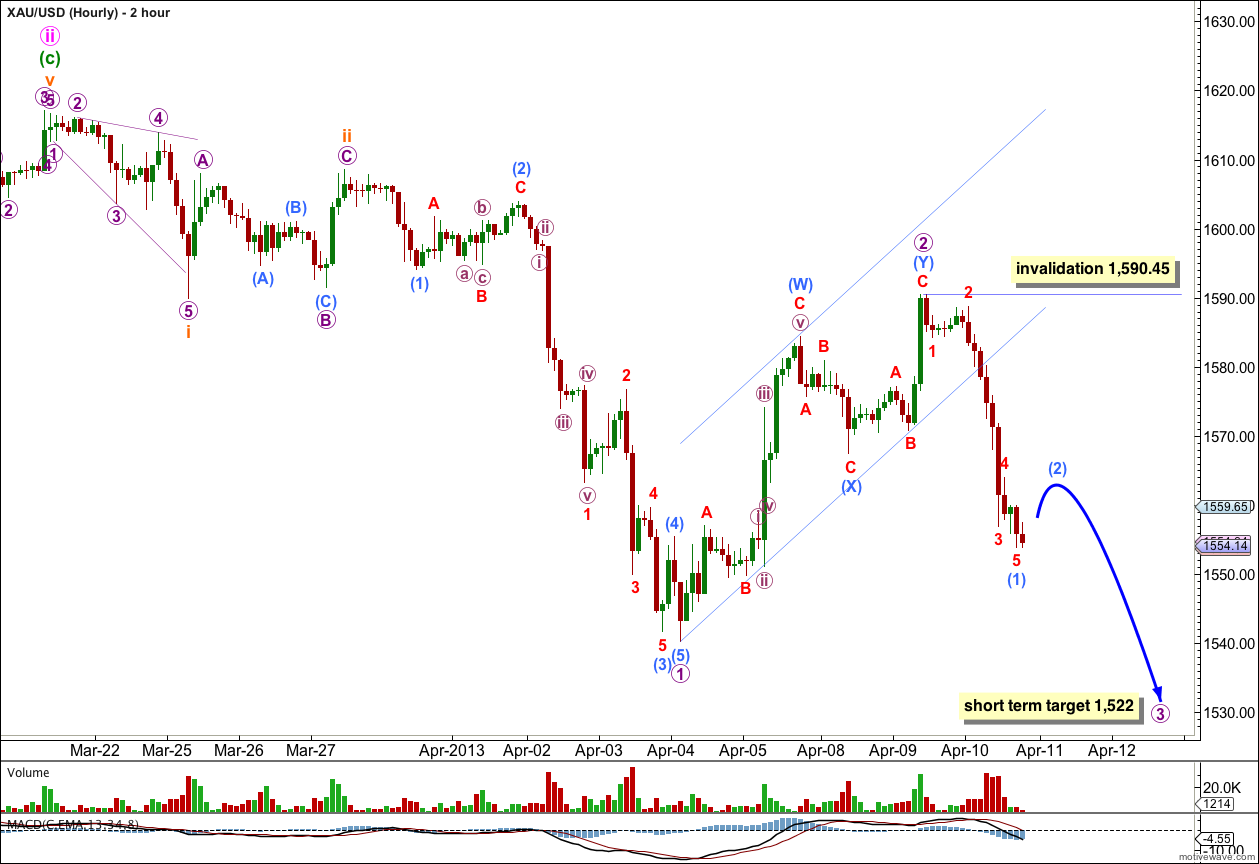
This week I will use a 2 hourly chart to show the whole movement from the end of minute wave ii.
From the start of minute wave iii so far this movement does not look like a five wave structure downwards. Minuette wave (i) is unlikely to be complete.
What is most likely is we are seeing yet another two degrees of overlapping first and second waves complete. Upwards movement labeled micro wave 2 cannot be subminuette wave iv because it has moved back into subminuette wave i price territory above 1,589.90.
Ratios within micro wave 1 are: submicro wave (3) is 1.14 short of 4.236 the length of submicro wave (1), and submicro wave (5) is just 0.72 longer than equality with submicro wave (1).
Ratios within submicro wave (3) are: miniscule wave 3 is 1.64 longer than 0.618 the length of miniscule wave 1, and miniscule wave 5 is 1.5 longer than 0.618 the length of miniscule wave 3.
Ratios within miniscule wave 1 are: nano wave iii has no Fibonacci ratio to nano wave i, and nano wave v is 1.27 short of 0.618 the length of nano wave iii.
Within micro wave 2 double zigzag there is no Fibonacci ratio between miniscule waves A and C of submicro wave (W), within submicro wave (X) miniscule wave C is 0.55 longer than 1.618 the length of miniscule wave A, and there is no Fibonacci ratio between miniscule waves A and C within submicro wave (Y).
A best fit parallel channel drawn about micro wave 2 shows a clear channel breach to the downside with impulsive movement. Micro wave 3 should be underway.
Within submicro wave (1) of micro wave 3 miniscule wave 3 has no Fibonacci ratio to miniscule wave 1, and miniscule wave 5 is so far 0.07 longer than 1.618 the length of miniscule wave 1. It may be likely that submicro wave (1) is over here and we shall see a little upwards movement for submicro wave (2) before downwards movement takes price to new lows with an increase in momentum.
If minute wave iii is extending then for it to begin with a series of overlapping first and second waves is actually very common. This wave count has a typical look.
At 1,522 micro wave 3 would reach equality in length with micro wave 1. This target should be met within another two to three sessions.
Micro wave 2 was a deep double zigzag structure. I would expect micro wave 4 to be a shallow flat correction, most likely.
Within micro wave 3 submicro wave (2) may not move beyond the start of submicro wave (1). This wave count is invalidated with movement above 1,590.45.