
The main hourly wave count expected upwards movement for Tuesday’s session. It was confirmed with a new high. Price is now within the first of two target zones and it looks like it shall now continue up into the second higher target zone.
The expected end date of 27th March did not eventuate. Unfortunately Fibonacci time relationships are not as reliable as price. We can look out for them, but should not be surprised when they do not happen.
The wave count is the same and the market looks like it is on track to reach the target and find resistance at the upper edge of our trend channel.
Click on the charts below to enlarge.
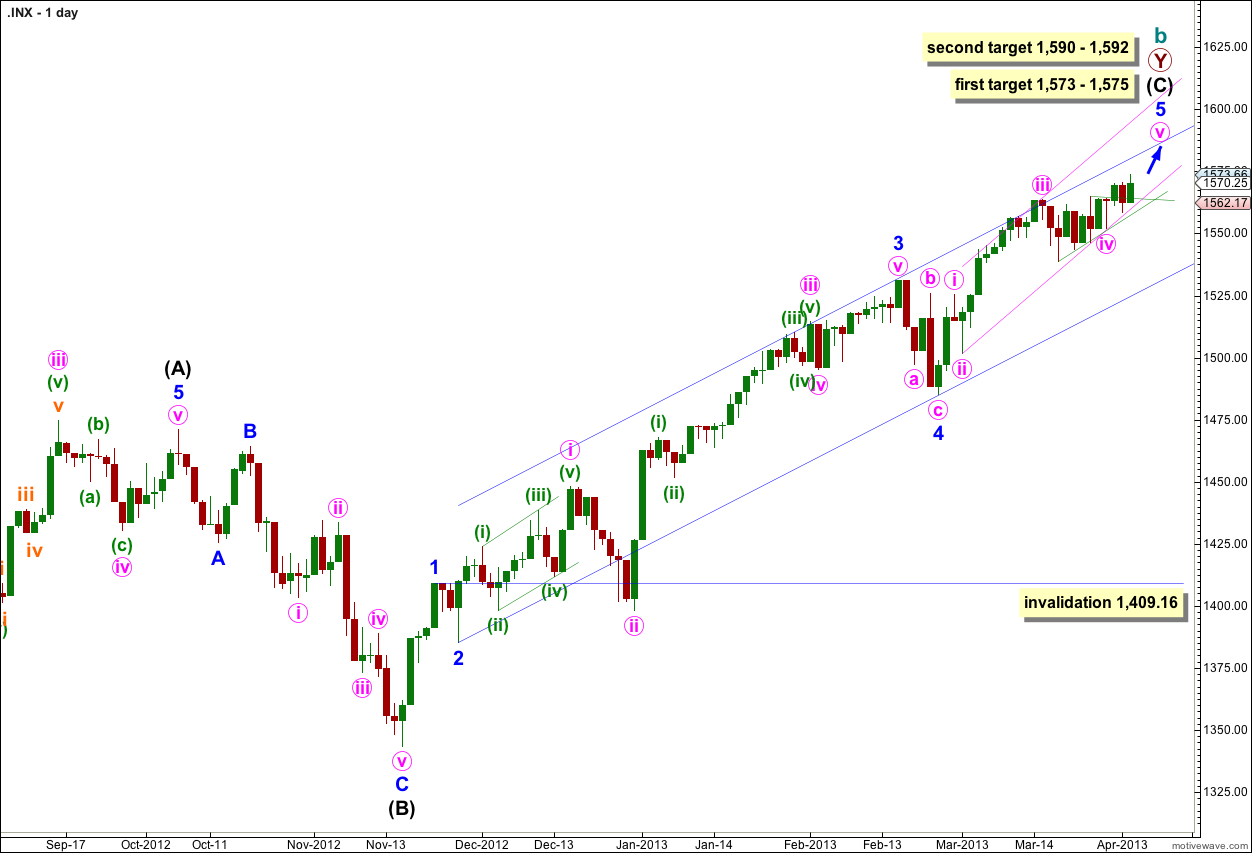
This structure is nearing completion. Cycle wave b is a double zigzag and the end of the second zigzag is nearly over. Intermediate wave (C) is unfolding as a simple impulse and remains recently contained within its trend channel. Price may find resistance at the upper end of this channel. Draw it first with a trend line from the lows of minor waves 2 to 4, then place a parallel copy upon the high of minor wave 3.
Cycle wave b is now 105% the length of cycle wave a and so this structure at super cycle degree is an expanded flat correction, the most common type of flat.
At 1,575 minor wave 5 would reach 0.618 the length of minor wave 3.
However, because the structure within minute wave v is incomplete it looks like the second target will be more likely.
At 1,590 intermediate wave (C) would reach 0.618 the length of intermediate wave (A). At 1,591 minor wave 5 would reach 1.618 the length of minor wave 1. At 1,592 minute wave v would reach equality in length with minute wave i. This gives us a high probability two point target based upon three wave degrees.
When price reaches the second target zone we will use an alternate wave count to see if the structure could be complete and a trend change could occur.
Movement below the channel containing intermediate wave (C) would be initial confirmation of a trend change. While price remains within this channel we shall expect more upwards movement.
Movement below 1,409.16 would provide price confirmation of a trend change as at that stage downwards movement could not be just a fourth wave correction within intermediate wave (C), and so intermediate wave (C) would have to be over.
There are two possible structures for minute wave v: a simple impulse (main hourly wave count) or an ending diagonal (alternate hourly wave count).
Main Hourly Wave Count.
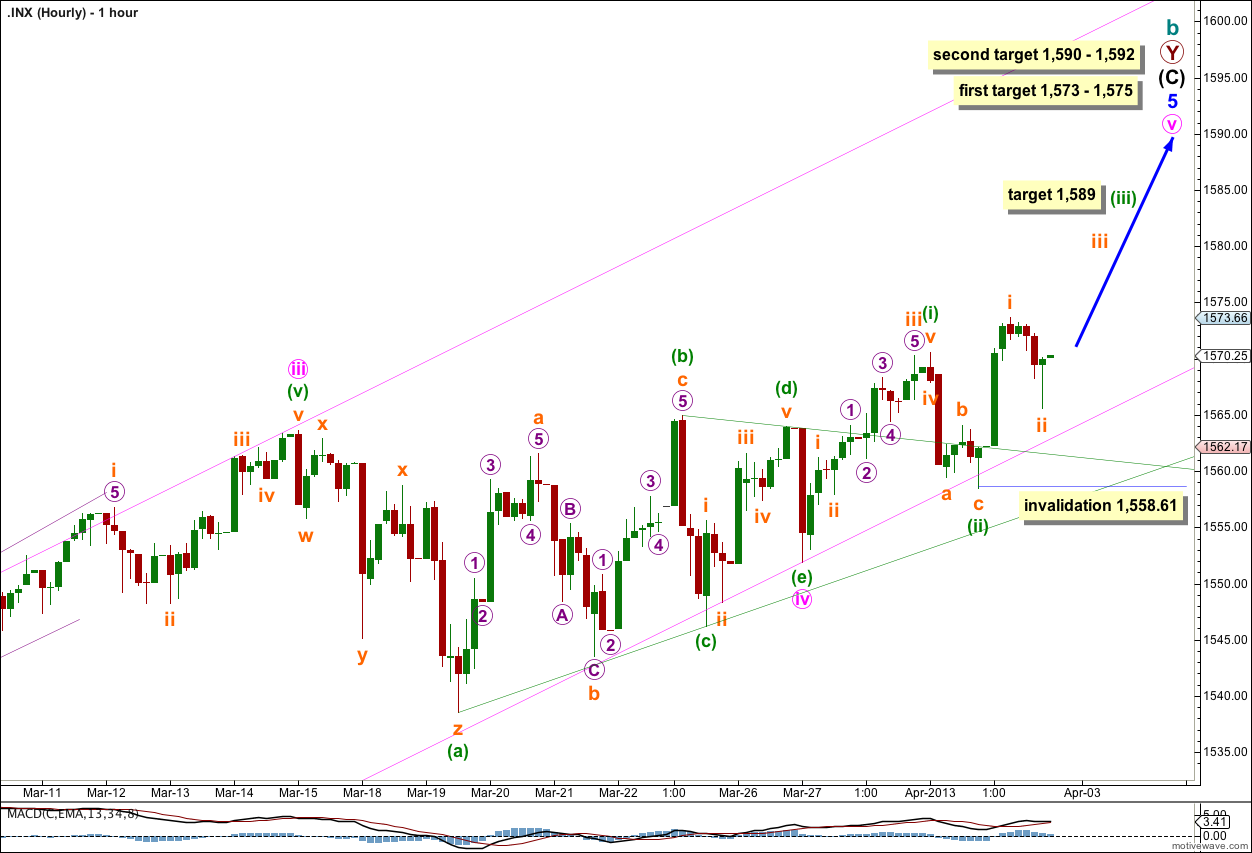
This main wave count has a higher probability than the alternate which means the end to upwards movement is at least a few days away, if not longer.
Minuette wave (i) is ambiguous; this movement may be seen as either a five or three wave structure on the five minute chart. This main wave count sees it as a five.
Minuette wave (ii) is clearly a three. It cannot be seen as a five.
Subminuette wave i is best seen as a five so this main wave count has a higher probability because it counts this movement as a five. It too is a little ambiguous and so the alternate wave count looks at the possibility that this was a three.
This main wave count sees minute wave v unfolding as an impulse and within it minuette wave (iii) is extending. At 1,589 minuette wave (iii) would reach 1.618 the length of minuette wave (i). This short term target may be one to four days away and fits only with the higher second target for cycle wave b to end.
Within minuette wave (iii) subminuette wave ii may not move beyond the start of subminuette wave i. This main wave count is invalidated with movement below 1,558.61.
Keep drawing the triangle trend lines and extend them outwards. The point in time at which these trend lines cross over may see a trend change. Look out for it, sometimes this works (but not always).
Alternate Hourly Wave Count.
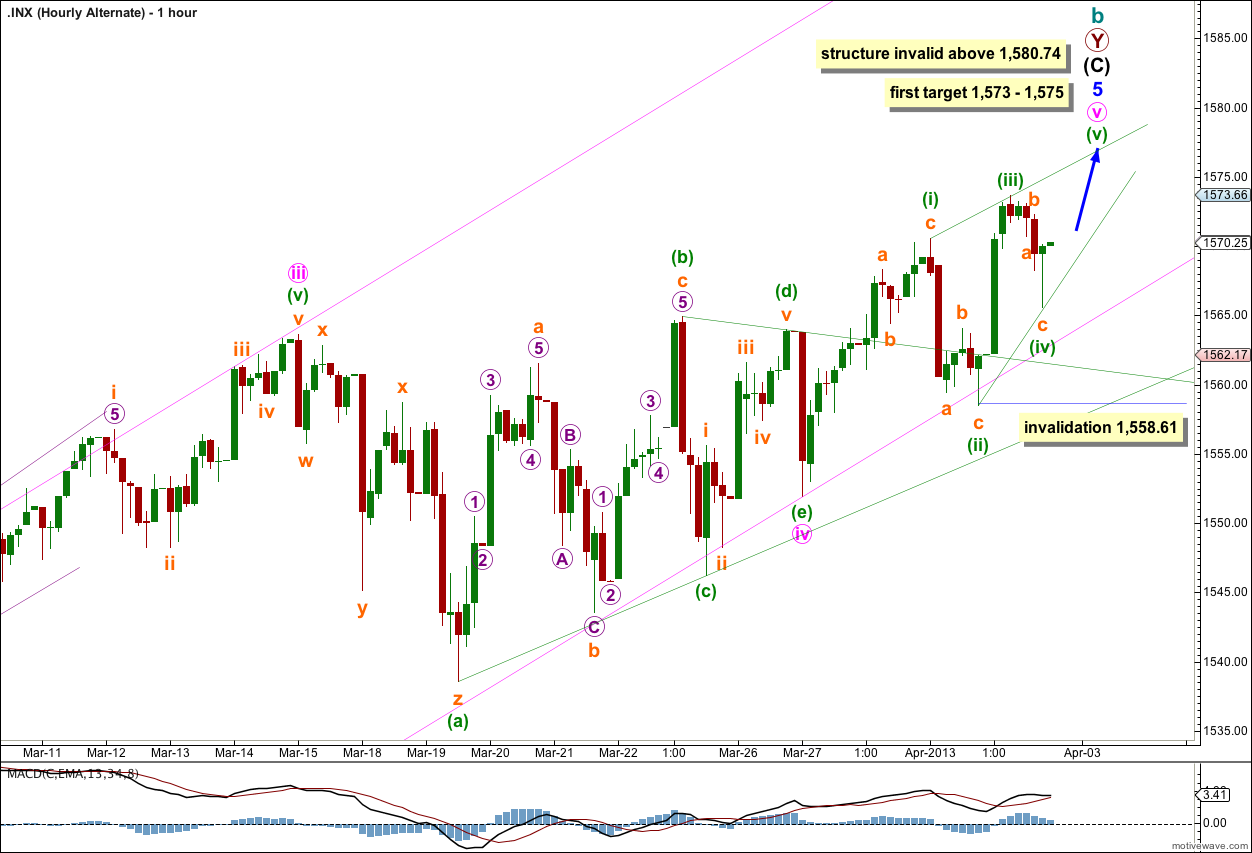
This alternate wave count looks at the only other structural possibility for minute wave v, an ending diagonal.
Within an ending diagonal all the subwaves (including the third) must subdivide into zigzags. The fourth wave should overlap the first wave price territory, but may not move beyond the end of the second wave. This wave count is invalidated with movement below 1,558.61.
This alternate also requires a little more upwards movement, but not as much as the main wave count. Because the diagonal may be contracting, if minuette wave (iii) is over it is shorter than minuette wave (i). This limits the length of minuette wave (v) to no longer than the third wave, because a third wave may never be the shortest. Movement above 1,580.74 would invalidate this diagonal structure.
Minuette wave (v) may find resistance about the upper diagonal trend line drawn from the highs of minuette waves (i) to (iii).