
Last analysis expected the S&P 500 to move higher during Thursday’s session, which it did. The targets have not yet been met, but are now very close.
Click on the charts below to enlarge.
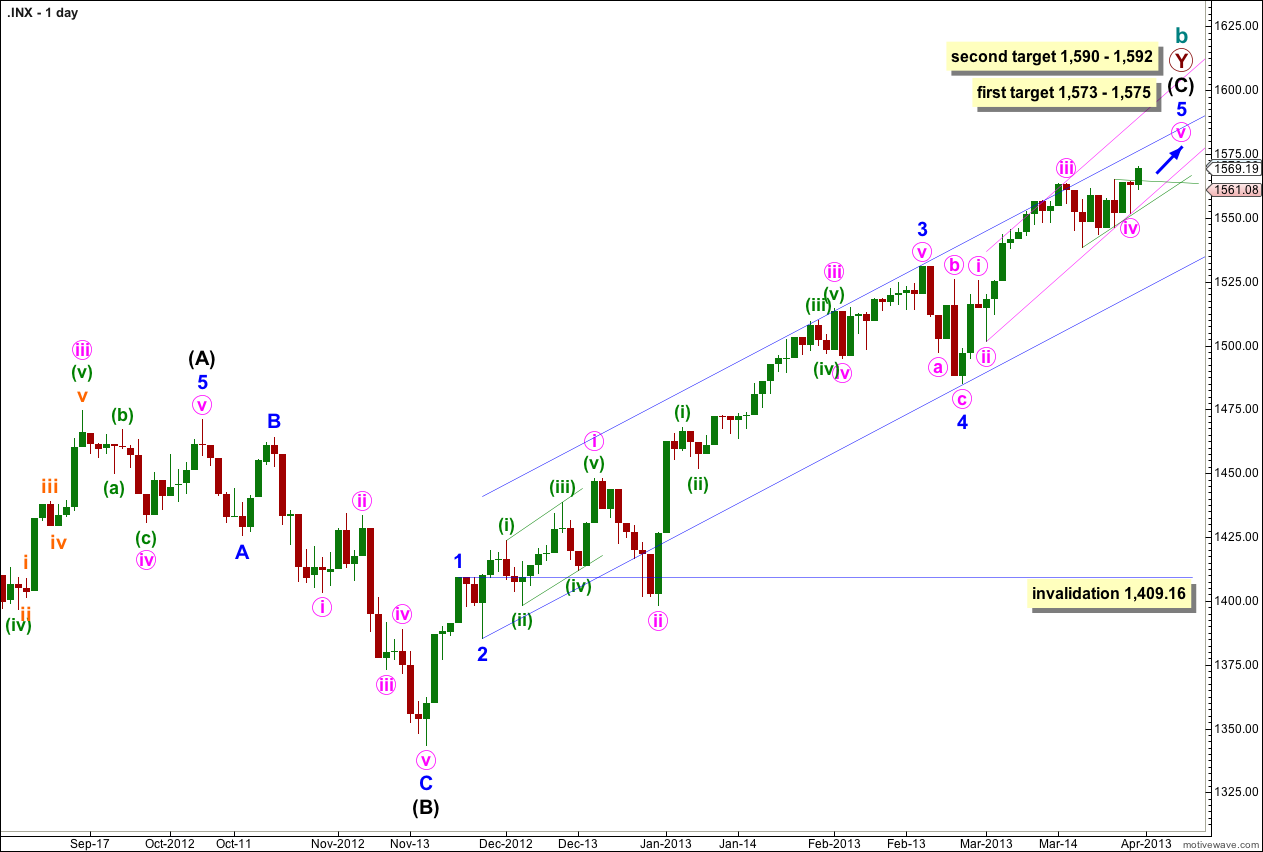
The structure is within the second zigzag of a double labeled primary wave Y. Within this second zigzag intermediate wave (C) may be incomplete.
Within intermediate wave (C) minor waves 1 through to 4 are most likely complete. We may use Elliott’s channeling technique to draw a channel about the impulse of intermediate wave (C). Draw the first trend line from the lows of minor waves 2 to 4, then place a parallel copy upon the high of minor wave 3. At this stage it looks like minor wave 5 may end about the upper edge of this channel.
At 1,573 cycle wave b would reach 105% the length of cycle wave a. This is the minimum requirement for a B wave in relation to an A wave within an expanded flat, and as expanded flats are the most common type of flat this price point has a good probability of being reached.
At 1,575 minor wave 5 would reach 0.618 the length of minor wave 3.
If price continues to move higher through the first target then we may use the second target. At 1,590 intermediate wave (C) would reach 0.618 the length of intermediate wave (A). At 1,591 minor wave 5 would reach 1.618 the length of minor wave 1. At 1,592 minute wave v would reach equality in length with minute wave i. This gives us a high probability two point target based upon three wave degrees.
Within intermediate wave (C) minor wave 4 may not move into minor wave 1 price territory. This wave count is invalidated with movement below 1,409.16.
Within intermediate wave (C) minor wave 1 has no Fibonacci duration lasting 4 days, minor wave 2 lasted a Fibonacci 3 days, minor wave 3 lasted a Fibonacci 55 days, and minor wave 4 lasted a Fibonacci 5 days. So far minor wave 5 has lasted 22 days and may be complete. If it does not end here then a further 12 sessions would take it to a Fibonacci 34. At each Fibonacci time duration I will look at the structure to see if it could be complete and if so we shall have an alternate wave count for that possibility.
At intermediate degree wave (C) has so far lasted 89 sessions.
If the alternate hourly wave count is correct then upwards movement has ended and minor wave 5 and intermediate wave (C) have Fibonacci time relationships. However, Fibonacci time relationships are not always reliable.
The next possible Fibonacci date would be 17th April. Alternatively, it may end with no Fibonacci time relationships within the final waves.
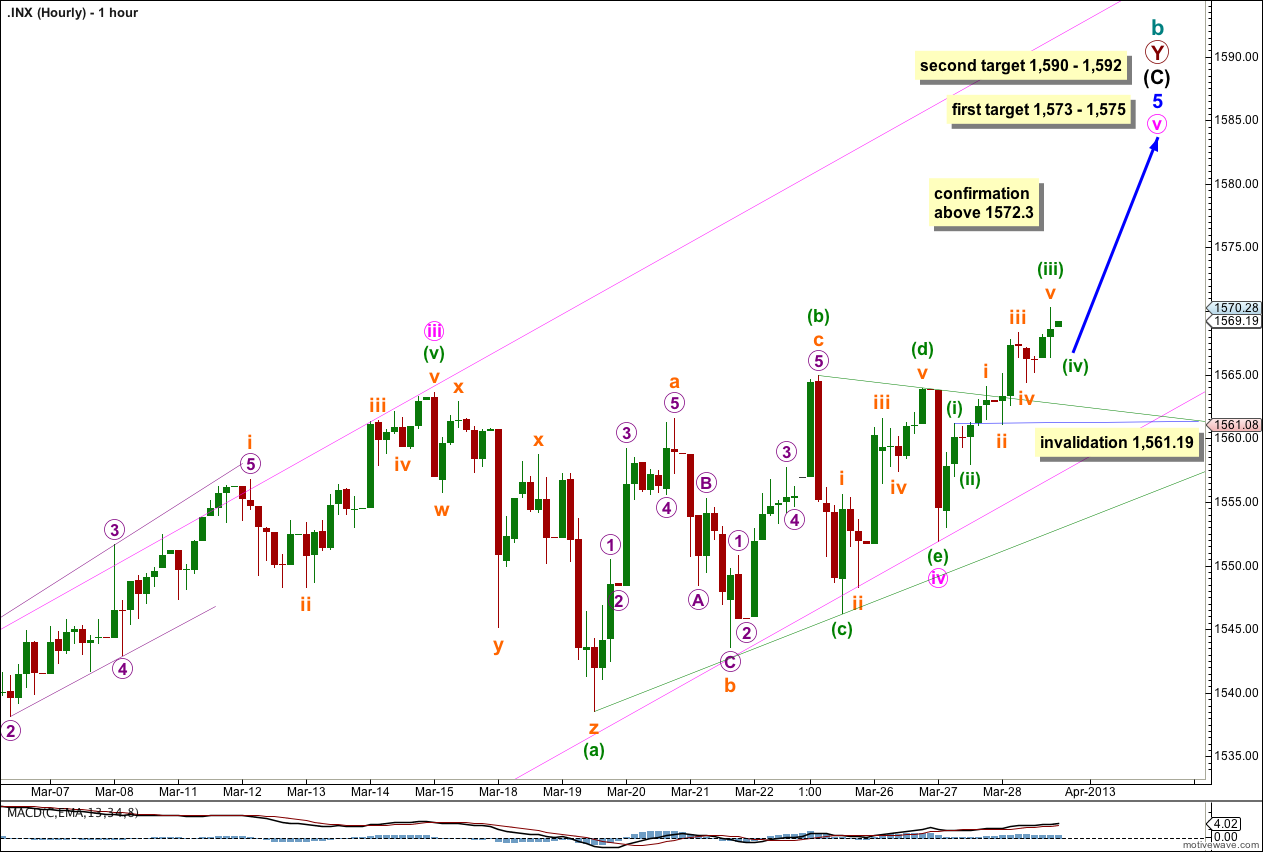
At this stage although minute wave iv is out of proportion to minute wave ii this wave count has the best fit. Minute wave ii was a brief zigzag and minute wave iv was a long lasting contracting triangle providing perfect alternation.
Minute wave v has begun. The variable for this wave count is the degree of labeling within minute wave v. It may already have minuette waves (i) and (ii) complete with minuette wave (iii) close to completion. If minuette wave (iii) moves a little higher to 1,573 it would reach 1.618 the length of minuette wave (i).
Movement above 1,572.3 would confirm this main hourly wave count and invalidate the alternate.
Minute wave v is unfolding as an impulse and the structure is incomplete. It requires further upwards movement.
Minuette wave (iv) may not move into minuette wave (i) price territory. This wave count is invalidated with movement below 1,561.19.
Alternate Hourly Wave Count.
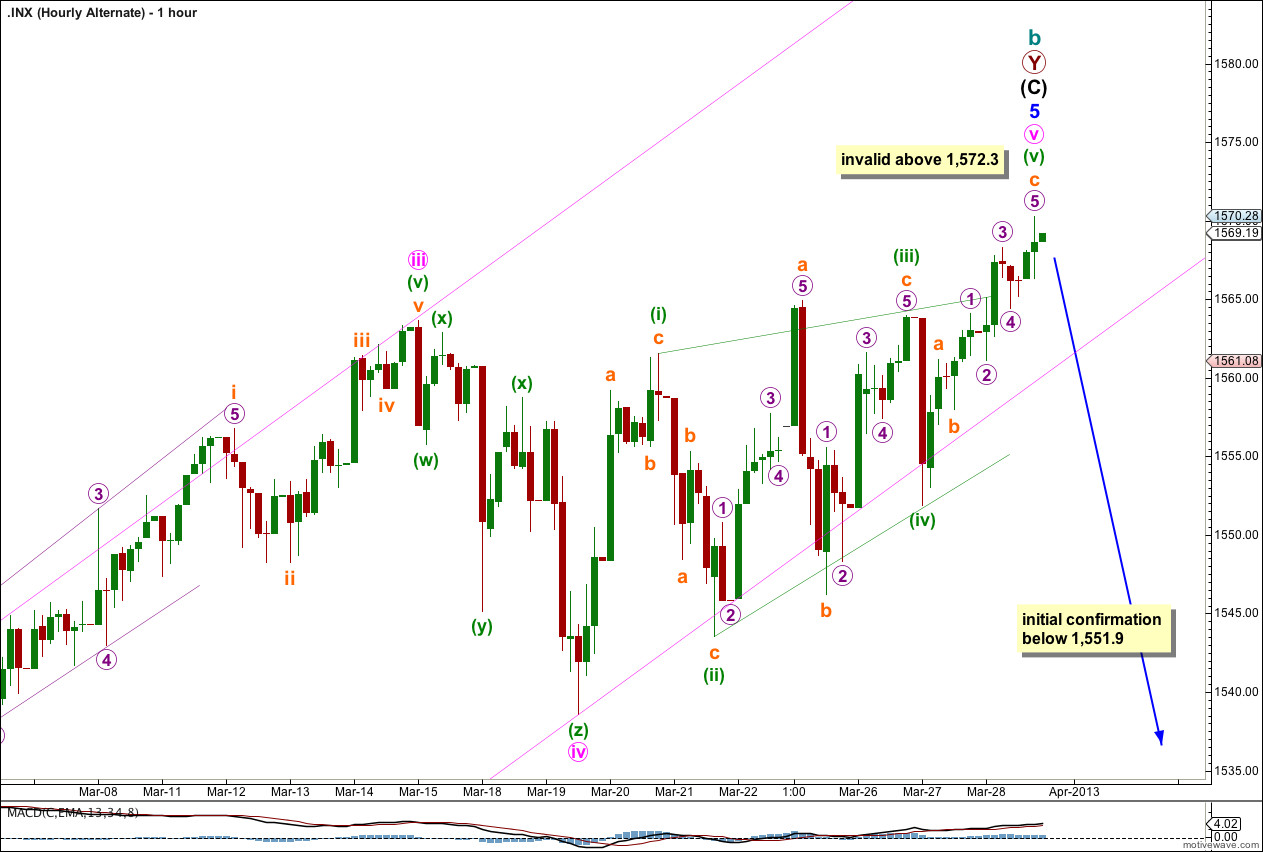
I have switched this wave count now to an alternate for three reasons.
1. The truncation within minuette wave (iii) zigzag makes the diagonal look odd.
2. Minuette wave (v) has moved beyond the upper trend line of the diagonal. Commonly within contracting diagonals fifth waves find resistance at the upper trend line. This does not have quite the right look.
3. If minute wave iv ended at 1,538.57 then the lower trend line of the parallel channel drawn from the lows of minute waves ii to iv is not exactly where price is finding support. This channel does not fit as well as the one on the main hourly wave count,
If minute wave v is over then we may have seen the end to the upwards trend of the last 48 months yesterday. However, we have absolutely no confirmation of a trend change. We should always assume the trend remains the same until proven otherwise.
Movement below 1,551.9 could not be must subminuette wave b within minuette wave (v) and so minuette wave (v) would have to be over. This may be a very early indication of a possible trend change. We would need to see price clearly breach the parallel channel on the daily chart to have any confidence in a trend change.