
Last analysis expected price to begin Thursday’s session with lower movement towards a target about 1,547.35. Price moved lower for Thursday to reach 3.8 points below the target. I had expected this downwards movement to be more brief but it has taken the entire session.
The wave count remains the same. The alternate is still a possibility to be aware of but should only be used if we have trend channel confirmation in the first instance.
Click on the charts below to enlarge.
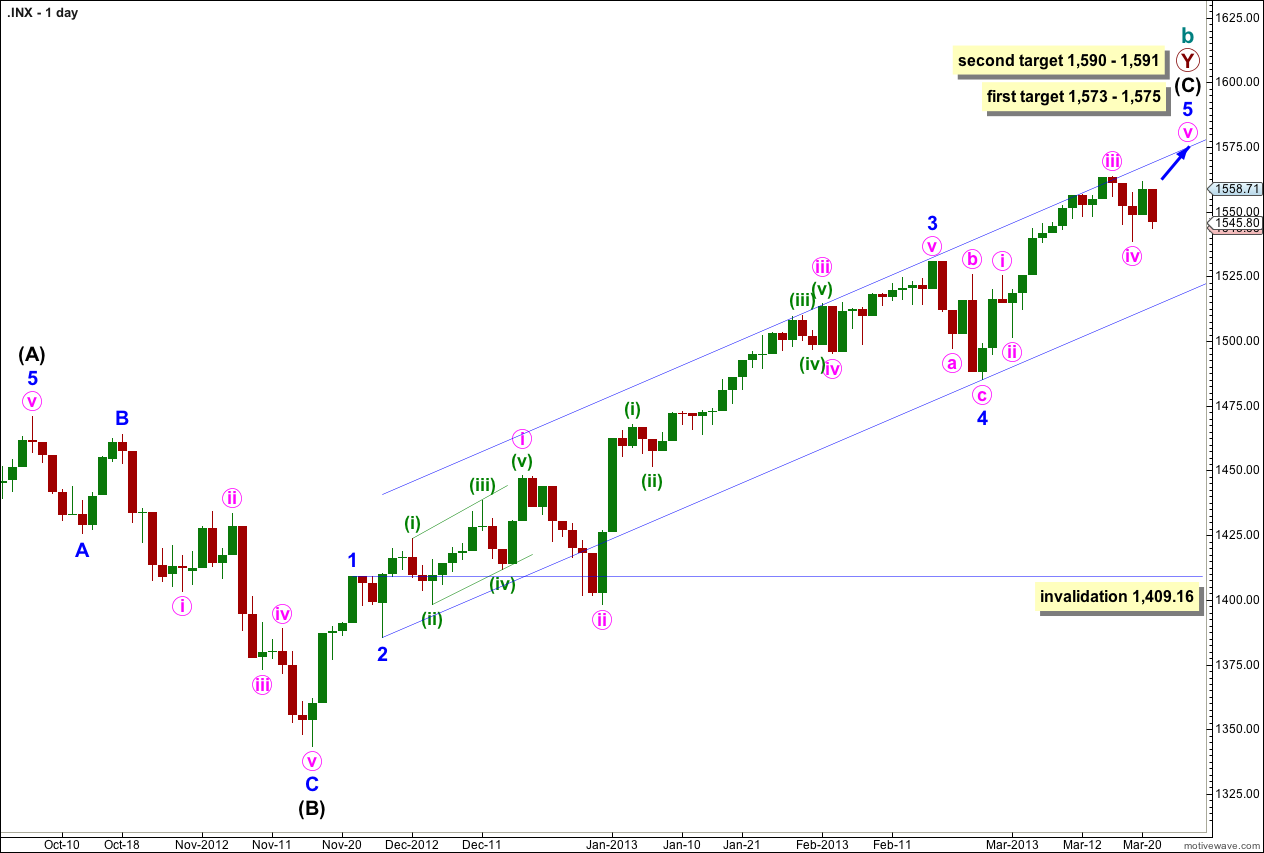
The structure is within the second zigzag of a double labeled primary wave Y. Within this second zigzag intermediate wave (C) may be incomplete.
Within intermediate wave (C) minor waves 1 through to 4 are most likely complete. We may use Elliott’s channeling technique to draw a channel about the impulse of intermediate wave (C). Draw the first trend line from the lows of minor waves 2 to 4, then place a parallel copy upon the high of minor wave 3. At this stage it looks like minor wave 5 may end about the upper edge of this channel.
At 1,573 cycle wave b would reach 105% the length of cycle wave a. This is the minimum requirement for a B wave in relation to an A wave within an expanded flat, and as expanded flats are the most common type of flat this price point has a good probability of being reached.
At 1,575 minor wave 5 would reach 0.618 the length of minor wave 3.
If price continues to move higher through the first target then we may use the second target. At 1,590 intermediate wave (C) would reach 0.618 the length of intermediate wave (A). At 1,591 minor wave 5 would reach 1.618 the length of minor wave 1. This gives us a high probability two point target based upon three wave degrees.
Within intermediate wave (C) minor wave 4 may not move into minor wave 1 price territory. This wave count is invalidated with movement below 1,409.16.
Within intermediate wave (C) minor wave 1 has no Fibonacci duration lasting 4 days, minor wave 2 lasted a Fibonacci 3 days, minor wave 3 lasted a Fibonacci 55 days, and minor wave 4 lasted a Fibonacci 5 days. So far minor wave 5 has lasted 17 days and may be incomplete. A possible end may be at a Fibonacci 21 days which will be in another 4 sessions. If it does not end there then a further 13 sessions would take it to a Fibonacci 34. At each Fibonacci time duration I will look at the structure to see if it could be complete and if so we shall have an alternate wave count for that possibility.
At intermediate degree wave (C) has so far lasted 84 sessions. In another 5 sessions it will have lasted a Fibonacci 89.
The most likely end to this trend may be 27th March, 2013 (give or take one day either side). However, Fibonacci time relationships are not always reliable. This is a guideline only.
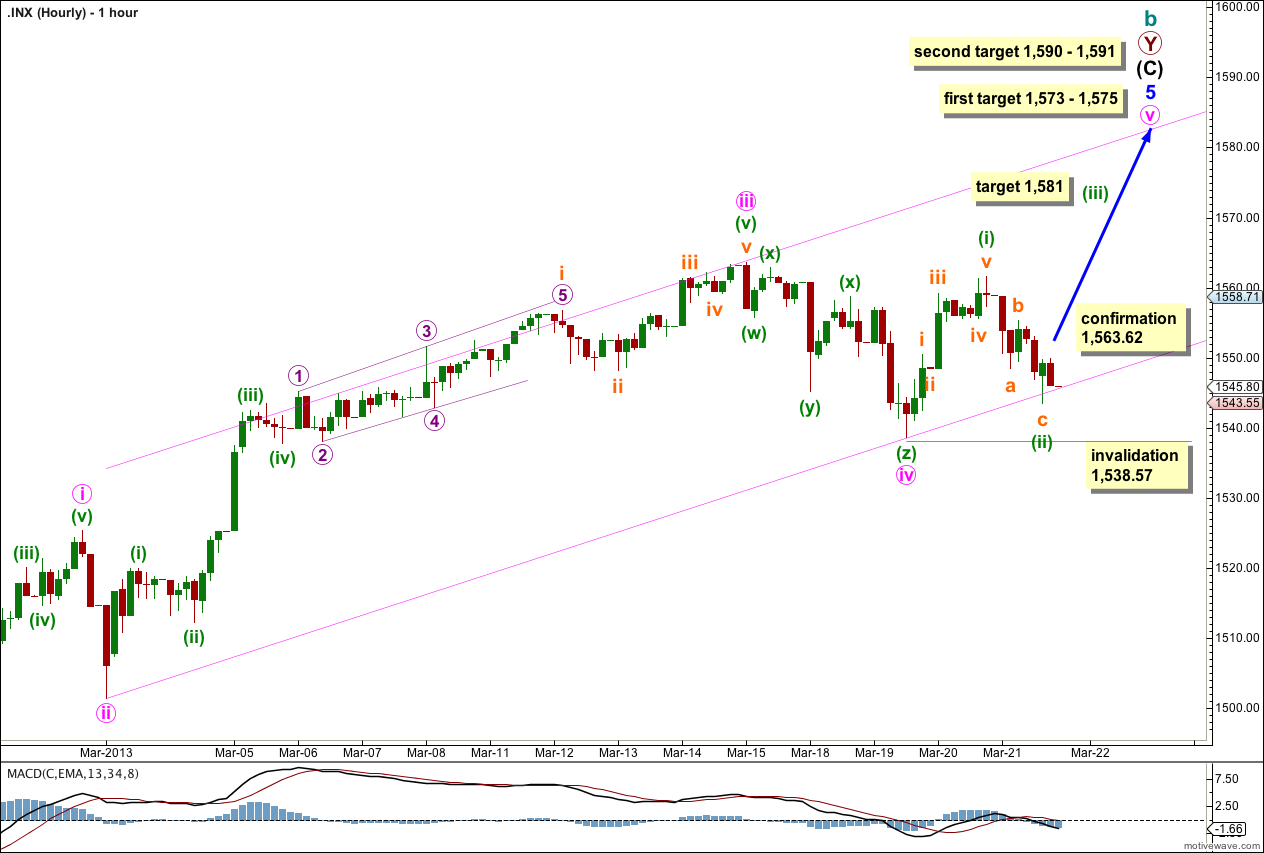
Downwards movement for Thursday’s session subdivides (so far) nicely into a three wave zigzag reaching to just below the 0.618 Fibonacci ratio of minuette wave (i). Price may find some support at the lower end of the parallel channel about minor wave 5.
At 1,581 minuette wave (iii) would reach 1.618 the length of minuette wave (i). This short term target may be met in one or two sessions and it fits with the second higher target for minor wave 5 to end.
Movement above 1,563.62 to a new high would invalidate the alternate wave count and confirm this main wave count. At that stage we may have more confidence in the targets and the possible end date of 27th March.
Minute wave v may end either midway within the channel or may find resistance at the upper edge.
When this smaller channel is breached on the hourly chart after minute wave v may be considered complete that would be a first and early indication of a possible trend change.
If minuette wave (ii) moves lower it may not move beyond the start of minuette wave (i). This wave count is invalidated at minuette degree with movement below 1,538.57.
If this wave count is invalidated with downwards movement I would adjust the wave count to see minute wave iv continuing and the invalidation point would move down to the high of minute wave i at 1,525.34. However, this would look strange as minute wave iv would be out of proportion to minute wave ii.
Alternate Daily Wave Count.
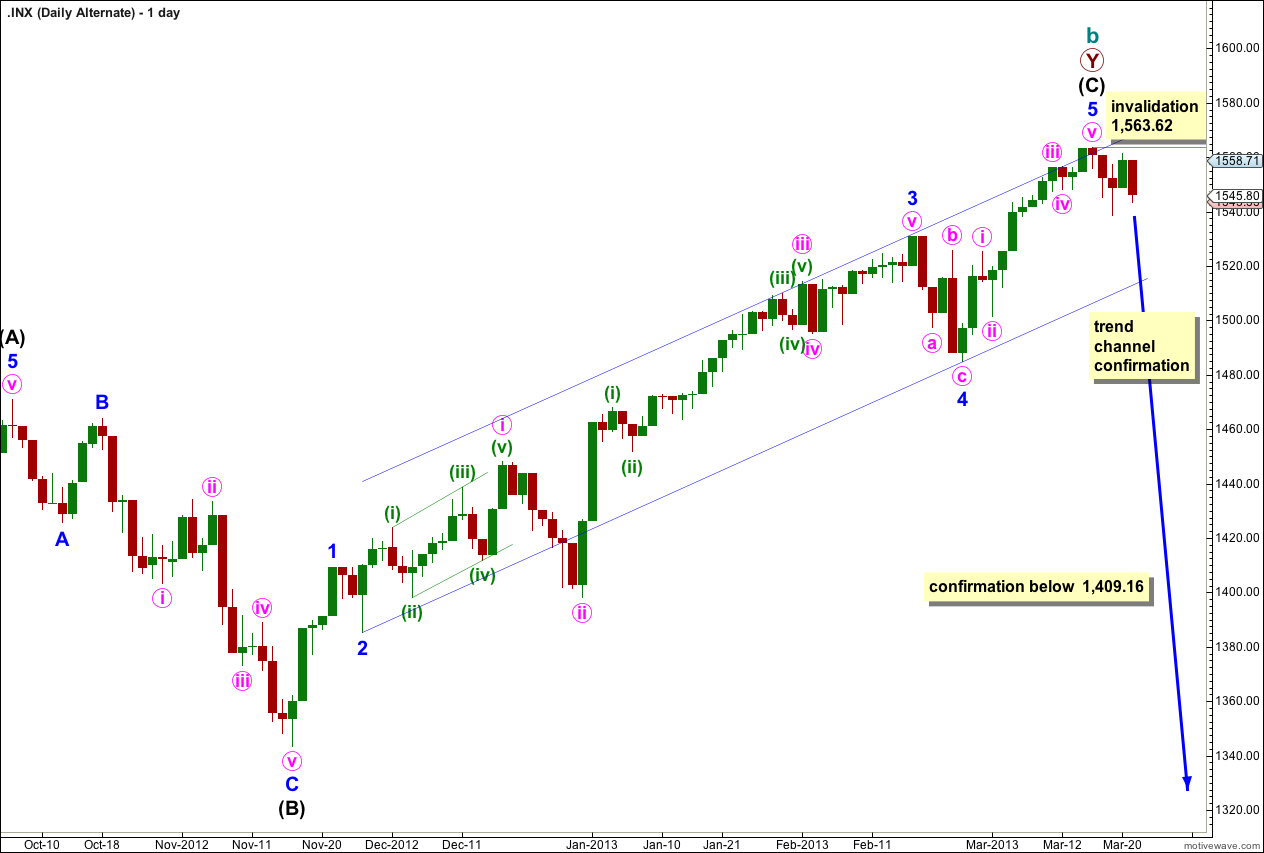
Again we must consider the possibility that we have seen a trend change at cycle degree a few days ago.
We would need to see movement below the blue parallel channel about intermediate wave (C) to have a little confidence in this wave count. At this stage it is just a possibility to be aware of; we have zero confirmation of a trend change.
We should always assume the trend remains the same until proven otherwise. At this stage we should assume the trend remains upwards, until we have confirmation that it has changed.
Any movement above 1,563.62 immediately invalidates this wave count and would give us more confidence in the targets on the main wave count.
Movement below 1,409.16 would provide confidence in a trend change. At that stage downwards movement could not be just a fourth wave correction within the last upwards wave, and so intermediate wave (C) would have to be over.