
Last week’s oil analysis expected overall upwards movement for the week. Price moved $1.50 higher during the week.
At this stage I think it is most likely that the correction is incomplete. I would expect another couple of days or so of upwards movement before a trend change.
I have an alternate wave count which sees the correction as just over. We may use confirmation / invalidation points to work with these two wave counts this week.
Click on the charts below to enlarge.
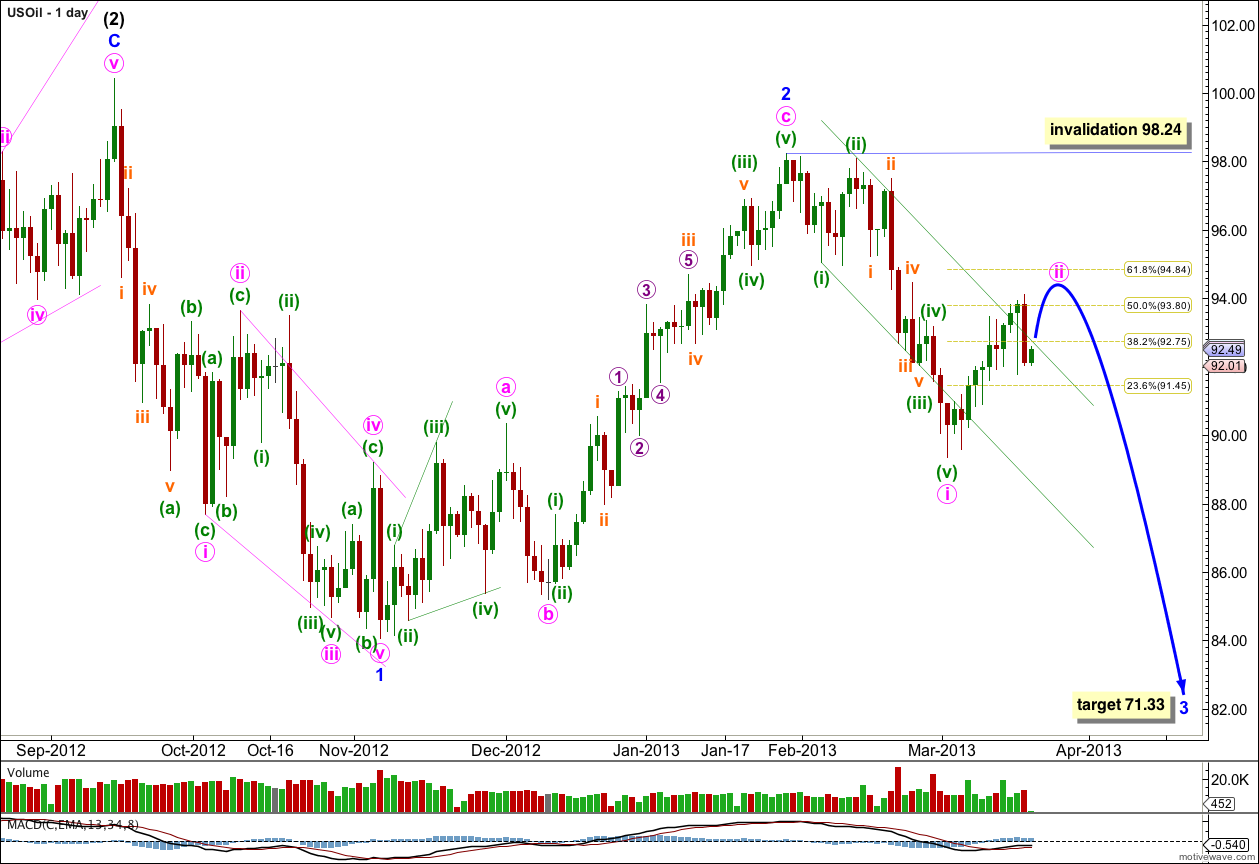
This wave count sees US Oil in a third wave downwards at intermediate degree, within a primary wave C down.
Within intermediate wave (3) minor waves 1 and 2 are complete.
Within minor wave 3 minute wave i is complete. Minute wave ii may not move beyond the start of minute wave i. This wave count is invalidated with movement above 98.24.
Two hourly charts below look at the structure of minute wave ii.
We may use Elliott’s channeling technique to draw a channel about minute wave i. Draw the first trend line from the lows of minuette waves (i) to (iii), then place a parallel copy upon the high of minuette wave (ii). Minuette wave (v) shows a typical spike below the channel, typical for commodities. I would expect minute wave ii to breach this channel with upwards movement.
Minor wave 3 must make a new low below the end of minor wave 1 at 84.07.
At 71.33 minor wave 3 would reach 1.618 the length of minor wave 1.
Main Two Hourly Wave Count.
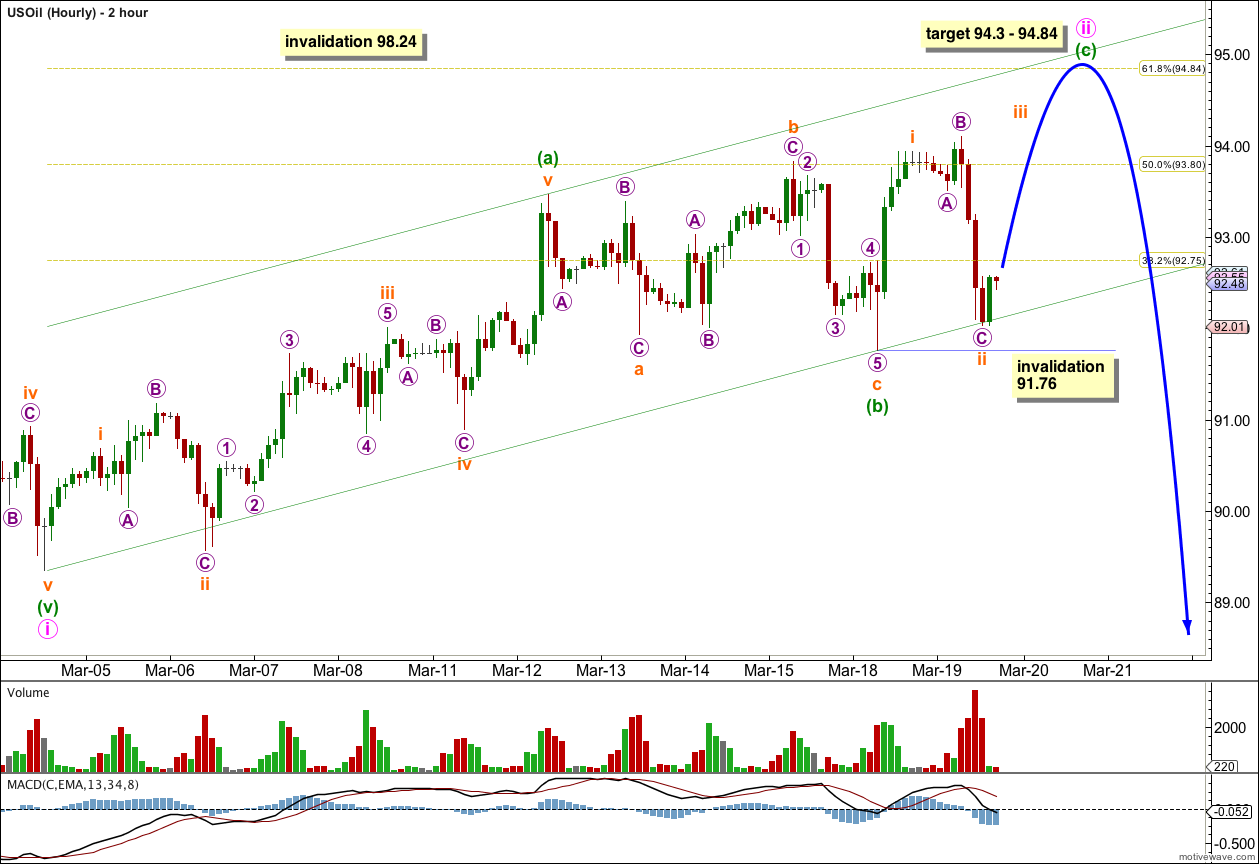
Within upwards movement minute wave ii may be an incomplete zigzag. Minuette wave (a) subdivides into a five wave impulse, and minuette wave (b) subdivides into an expanded flat correction.
Ratios within minuette wave (a) are: subminuette wave iii has no Fibonacci ratio to subminuette wave i, and subminuette wave v is 0.13 longer than equality with subminuette wave iii.
Subminuette wave v looks like a three on the two hourly chart, but can be seen as a five on the five minute chart.
Ratios within subminuette wave iii are: micro wave 3 is 0.06 short of 1.618 the length of micro wave 1, and micro wave 5 has no Fibonacci ratio to either of micro waves 1 or 3.
Within minuette wave (b) subminuette wave b is a 124% correction of subminuette wave a, and subminuette wave c has no Fibonacci ratio to subminuette wave a.
Within subminuette wave a there is no Fibonacci ratio between micro waves A and C. Within subminuette wave b flat correction micro wave C is 0.04 longer than 1.618 the length of micro wave A. Within subminuette wave c micro wave 3 has no Fibonacci ratio to micro wave 1, and micro wave 5 is just 0.02 longer than 0.618 the length of micro wave 3.
At 94.3 minuette wave (c) would reach 0.618 the length of minuette wave (a). At 94.84 minute wave ii would reach the 0.618 Fibonacci ratio of minute wave i.
Within minuette wave (c) subminuette wave ii may not move beyond the start of subminuette wave i. This main wave count is invalidated with movement below 91.76.
Movement below the parallel channel containing the zigzag of minute wave ii would indicate that the correction is over. The next wave should be a strong third wave downwards.
Alternate Two Hourly Wave Count.

It is possible that minute wave ii is complete. Minuette waves (a) and (c) would have no Fibonacci ratio to each other.
On the five minute chart it is possible to see minuette wave (c) as a five wave impulse, although this movement is better seen as a three. This reduces the probability for this alternate wave count.
Movement below 91.76 would invalidate the main wave count and confirm this alternate. It would also bring price below the parallel channel containing minute wave ii giving more confidence in a trend change.
At 79.72 minute wave iii would reach 1.618 the length of minute wave i.
Within minute wave iii no second wave correction may move beyond the start of its first wave. This alternate is invalidated with movement above 94.10.