
Last analysis dated 5th March, 2013, expected to see oil move higher for the week which is exactly what it has done.
Now that there is some structure to analyse for this upwards movement I can calculate targets for it to end.
I still have just the one daily and one hourly wave count for oil.
Click on the charts below to enlarge.
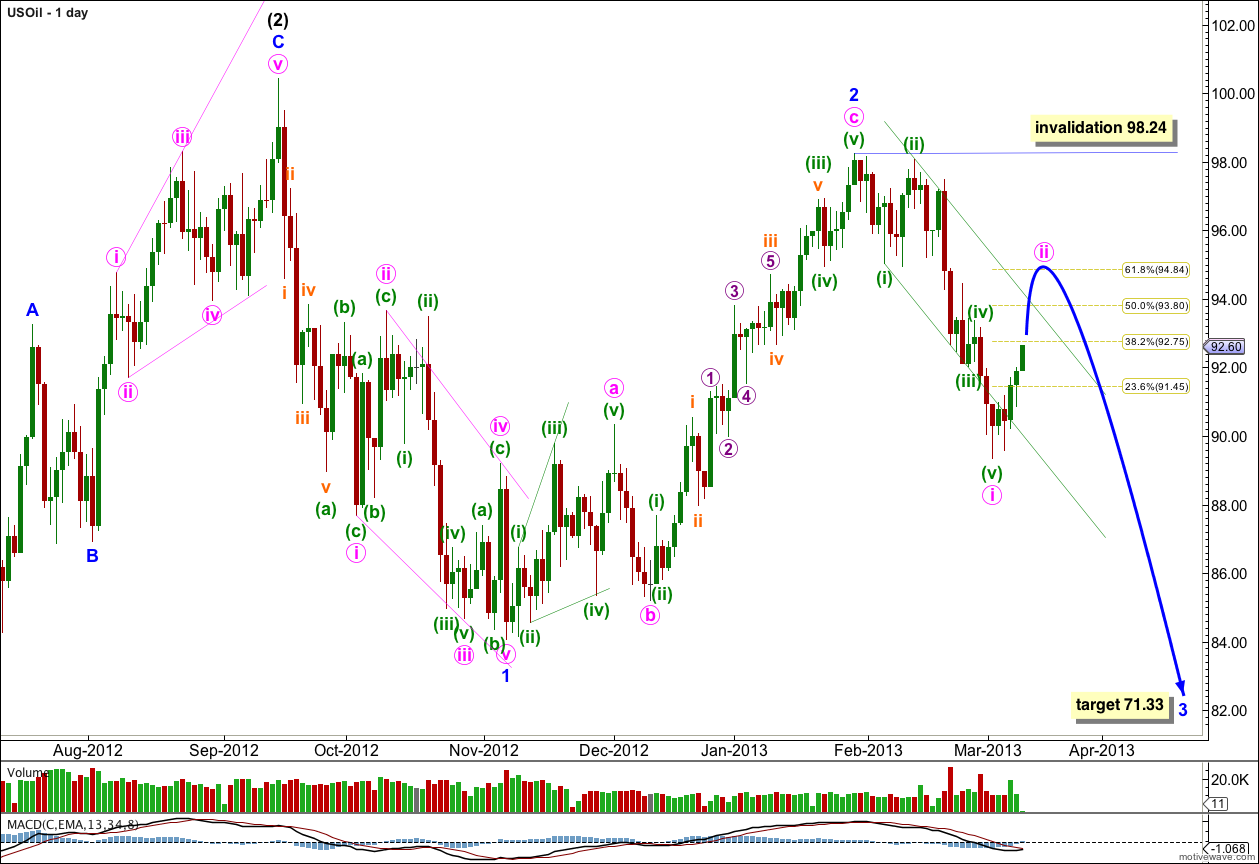
This wave count sees US Oil in a third wave downwards at intermediate degree, within a primary wave C down.
Within intermediate wave (3) minor waves 1 and 2 are complete.
Within minor wave 3 minute wave i may now be complete. Minute wave ii may not move beyond the start of minute wave i. This wave count is invalidated with movement above 98.24.
Minute wave ii looks most likely be unfolding as a deep zigzag correction which may end about the 0.618 Fibonacci ratio of minute wave i about 94.84.
We may use Elliott’s channeling technique to draw a channel about minute wave i. Draw the first trend line from the lows of minuette waves (i) to (iii), then place a parallel copy upon the high of minuette wave (ii). Minuette wave (v) shows a typical spike below the channel, typical for commodities. I would expect minute wave ii to breach this channel with upwards movement.
Minor wave 3 must make a new low below the end of minor wave 1 at 84.07.
At 71.33 minor wave 3 would reach 1.618 the length of minor wave 1.
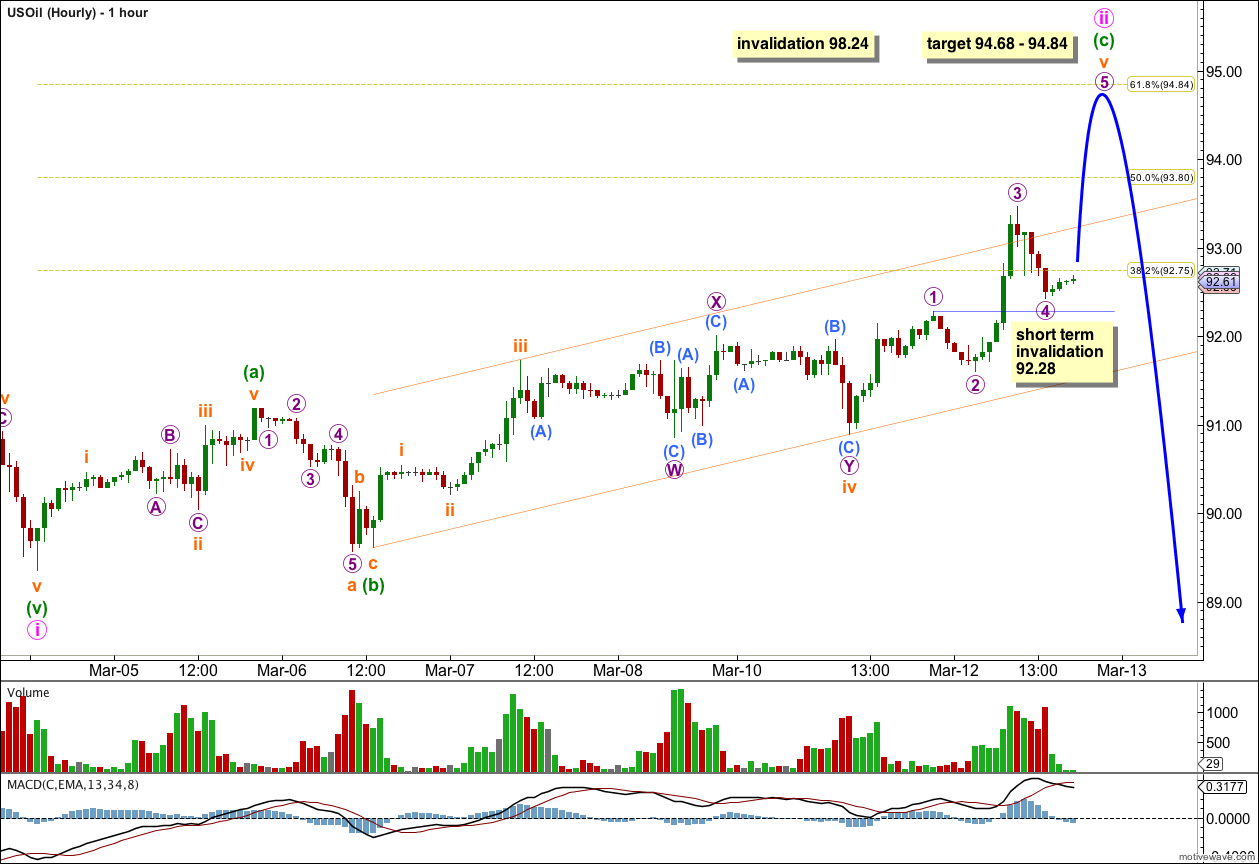
Within minute wave ii minuette wave (a) subdivides into a five wave impulse. Minuette wave (b) is less than 90% the length of minuette wave (a) and so minute wave ii looks to be a zigzag.
Within minuette wave (c) the structure is incomplete and so I would expect some more upwards movement to end this correction.
Within minuette wave (c) subminuette wave iii is just 0.01 longer than 1.618 the length of subminuette wave i. At 94.84 subminuette wave v would reach exactly 2.618 the length of subminuette wave iii which is also exactly the 0.618 Fibonacci ratio of minute wave i.
At 94.68 micro wave 5 within subminuette wave v would reach 1.618 the length of micro wave 1.
In the short term prior to the end of this correction micro wave 4 may not move into micro wave 1 price territory. This wave count is invalidated at micro degree with movement below 92.28.
When micro wave 5 can be seen as a five wave structure then this short term invalidation point no longer applies.
So far minute wave ii has lasted five days. It may take another three sessions to last a Fibonacci 8, or it may have no Fibonacci time relationship. This is a guideline only. Price is a more reliable indicator of when this correction may end.
Minute wave ii may not move beyond the start of minute wave i. This wave count is invalidated with movement above 98.24.