
Last analysis expected slow upwards movement for Monday’s session to a target at 1,556. Price reached up to 1,556.22 during the session.
The wave count remains the same. I still have just the one daily and one hourly chart for you.
Click on the charts below to enlarge.
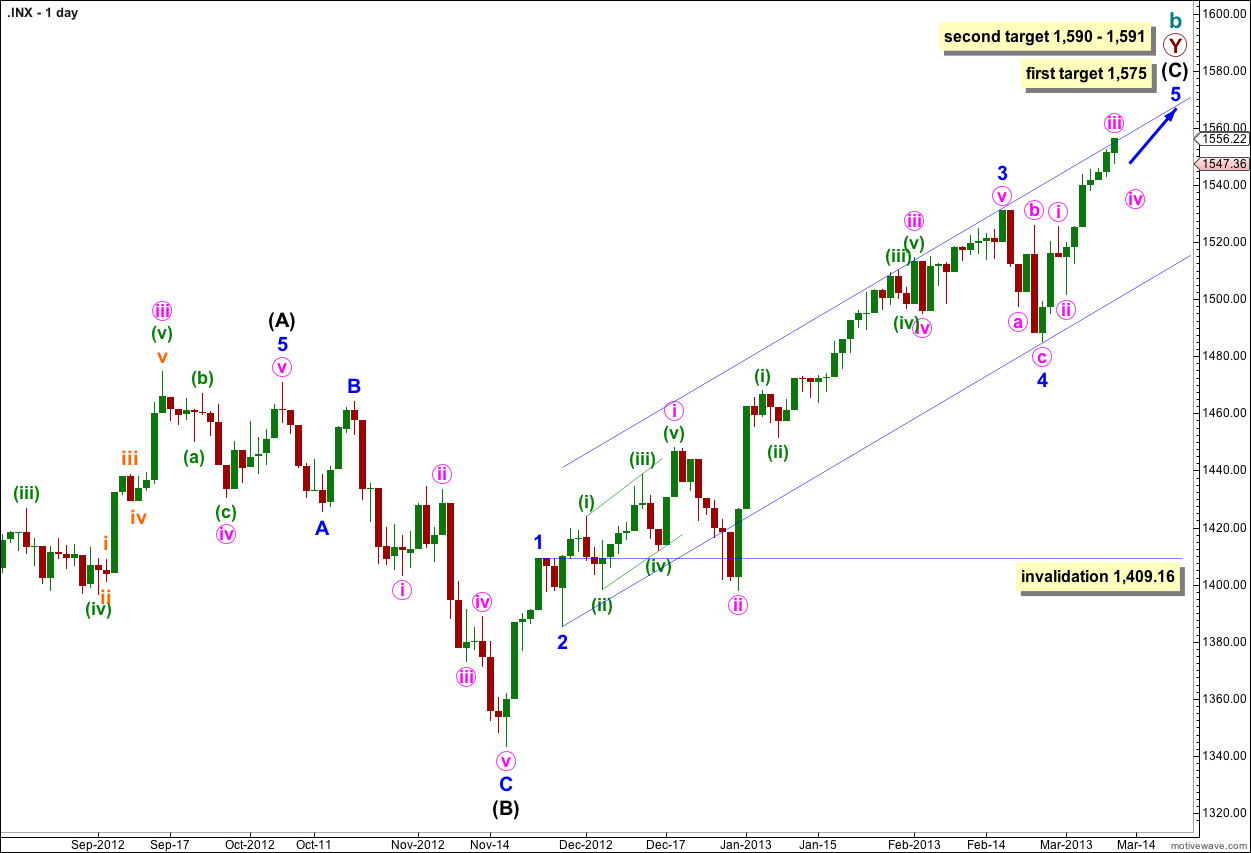
The structure is within the second zigzag of a double labeled primary wave Y. Within this second zigzag intermediate wave (C) is most likely incomplete.
Within intermediate wave (C) minor waves 1 through to 4 are most likely complete. We may use Elliott’s channeling technique to draw a channel about the impulse of intermediate wave (C). Draw the first trend line from the lows of minor waves 2 to 4, then place a parallel copy upon the high of minor wave 3. At this stage it looks like minor wave 5 may end about the upper edge of this channel.
At 1,573 cycle wave b would reach 105% the length of cycle wave a. This is the minimum requirement for a B wave in relation to an A wave within an expanded flat, and as expanded flats are the most common type of flat this price point has a good probability of being reached.
At 1,575 minor wave 5 would reach 0.618 the length of minor wave 3.
If price continues to move higher through the first target then we should expect the next likely target to be at 1,590 where intermediate wave (C) would reach 0.618 the length of intermediate wave (A), and at 1,591 minor wave 5 would reach 1.618 the length of minor wave 1.
Within intermediate wave (C) minor wave 4 may not move into minor wave 1 price territory. This wave count is invalidated with movement below 1,409.16.
Within intermediate wave (C) minor wave 1 has no Fibonacci duration lasting 4 days, minor wave 2 lasted a Fibonacci 3 days, minor wave 3 lasted a Fibonacci 55 days, and minor wave 4 lasted a Fibonacci 5 days. So far minor wave 5 has lasted 9 days and is incomplete. A possible end may be at a Fibonacci 21 days which will be in another 12 sessions. If it does not end there then a further 13 sessions would take it to a Fibonacci 34. At each Fibonacci time duration I will look at the structure to see if it could be complete and if so we shall have an alternate wave count for that possibility.
At intermediate degree wave (C) has so far lasted 76 sessions. In another 13 sessions it will have lasted a Fibonacci 89.
The most likely end to this trend may be 28th March, 2013 (give or take one day either side). However, Fibonacci time relationships are not always reliable. This is a guideline only.
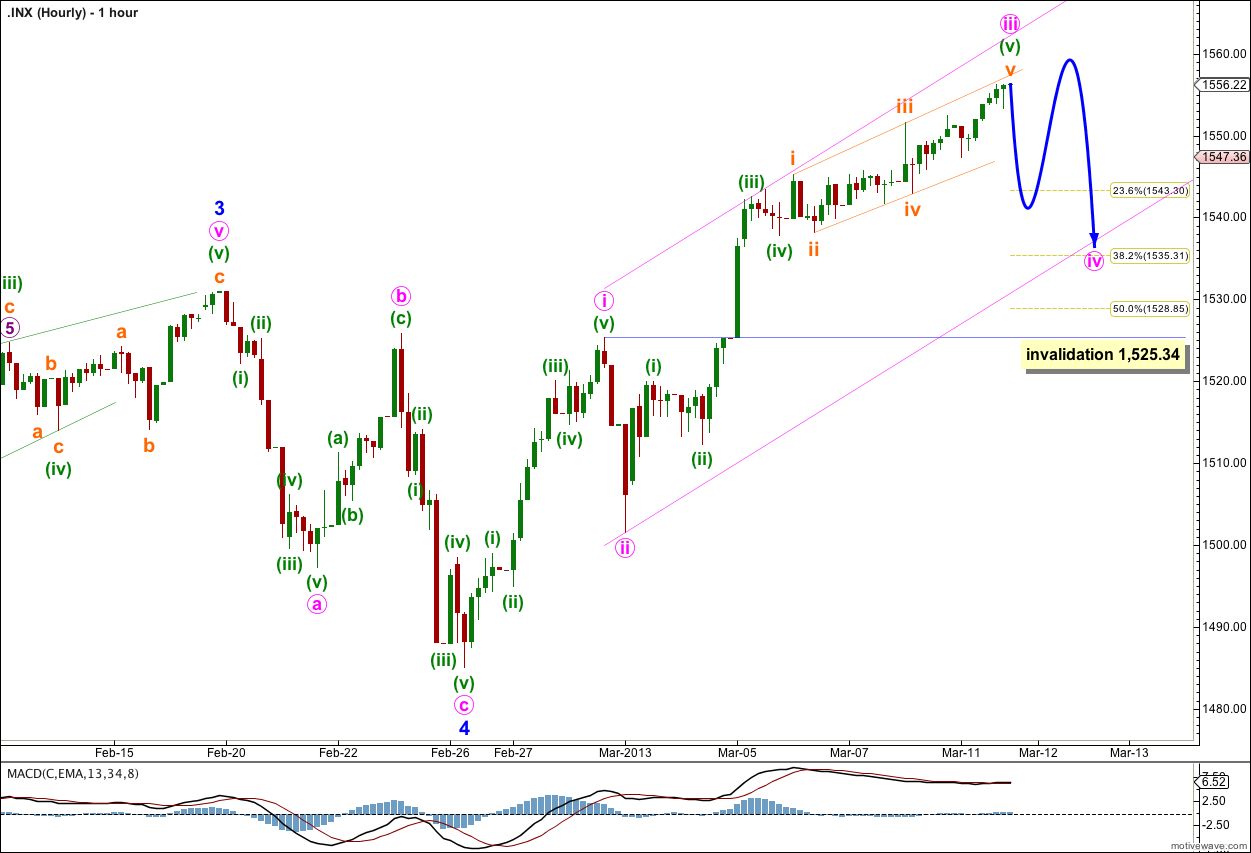
Minute wave iii may have ended during Monday’s session just 0.22 points above the target. Minute wave iii has no Fibonacci ratio to minute wave i.
Ratios within minute wave iii are: minuette wave (iii) is just 0.29 longer than 1.618 the length of minuette wave (i), and minuette wave (v) is just 0.08 points short of equality with minuette wave (i).
Within the ending diagonal of minuette wave (v) subminuette wave v is 0.26 points short of equality with subminuette wave iii. If price moves 0.26 points or a very little more higher to begin tomorrow’s session then this diagonal would have correct wave lengths.
Thereafter, I would expect the start of a fourth wave correction for minute wave iv.
Minute wave ii was a sharp brief zigzag so I would expect minute wave iv to be a shallow flat, double combination, double flat or triangle. It is likely to end about the 0.382 Fibonacci ratio of minute wave iii at 1,535.
Minute wave iv may not move into minute wave i price territory. This wave count is invalidated with movement below 1,525.34.
The channel drawn here is a best fit. Draw the first trend line from the highs of minute waves i to iii, then push it out further to sit along the high of minuette wave (iii) within minute wave iii. Place a parallel copy upon the low of minute wave ii. Downwards movement may find support at the lower end of this channel.