
Yesterday’s analysis expected more upwards movement from the S&P 500 for Wednesday’s session. The short term target however at 1,566 was not met. There is a Fibonacci ratio for this fifth wave, but not the one I was expecting.
It is at this point that our main and alternate hourly wave counts diverge. The main wave count continues to have a better look and a higher probability. If it is invalidated then the alternate may be used.
With the Dow making a new all time high this week I expect the S&P 500 will follow, and should do if the main wave count is correct. It may now be noted that the new monthly wave count and the alternate expanding triangle are both correct for the Dow, and if the S&P 500 makes a new all time high then an expanding super cycle degree triangle will also be possible for this index.
Click on the charts below to enlarge.
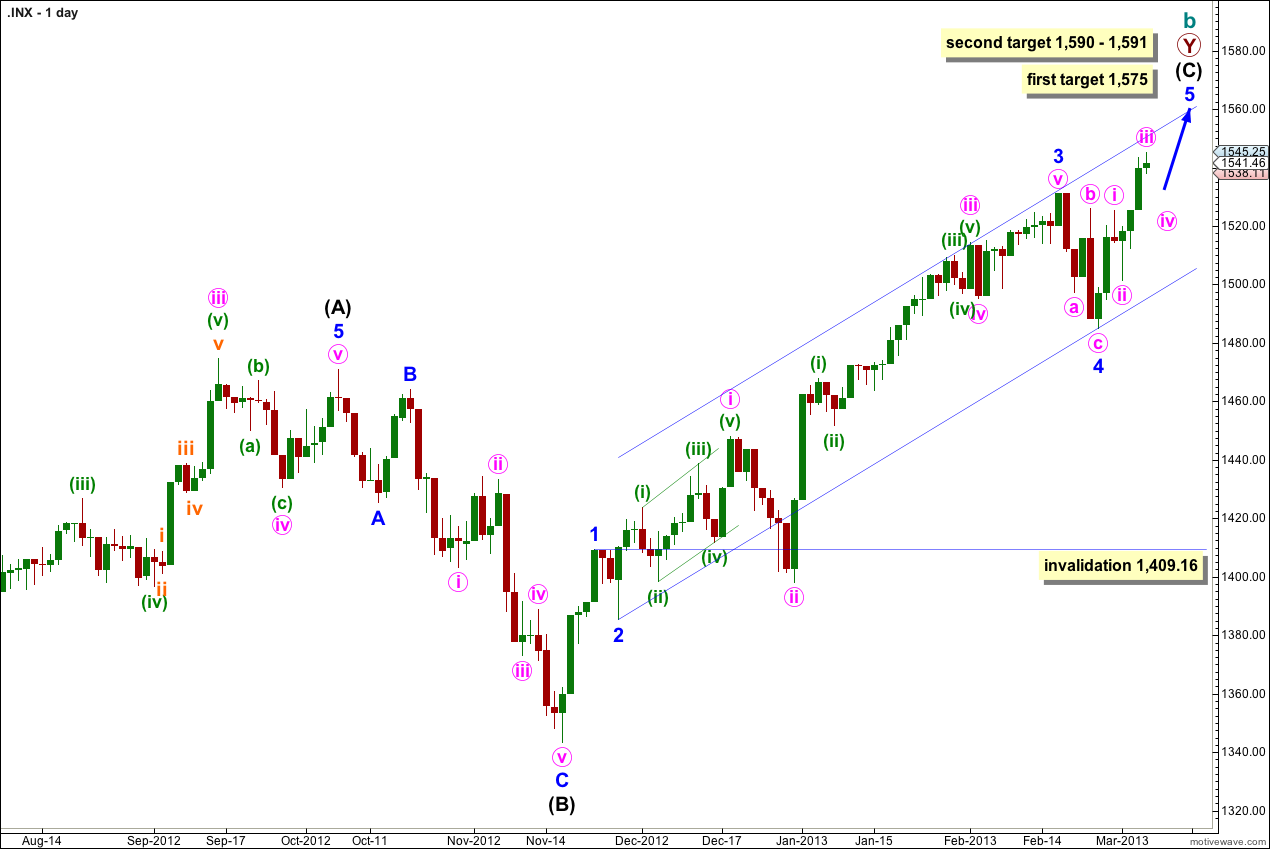
The structure is within the second zigzag of a double labeled primary wave Y. Within this second zigzag intermediate wave (C) is most likely incomplete.
Within intermediate wave (C) minor waves 1 through to 4 are most likely complete. We may use Elliott’s channeling technique to draw a channel about the impulse of intermediate wave (C). Draw the first trend line from the lows of minor waves 2 to 4, then place a parallel copy upon the high of minor wave 3. At this stage it looks like minor wave 5 may end about the upper edge of this channel.
At 1,575 minor wave 5 would reach 0.618 the length of minor wave 3.
If price continues to move higher through the first target then we should expect the next likely target to be at 1,590 where intermediate wave (C) would reach 0.618 the length of intermediate wave (A), and at 1,591 minor wave 5 would reach 1.618 the length of minor wave 1.
Within intermediate wave (C) minor wave 4 may not move into minor wave 1 price territory. This wave count is invalidated with movement below 1,409.16.
Within intermediate wave (C) minor wave 1 has no Fibonacci duration lasting 4 days, minor wave 2 lasted a Fibonacci 3 days, minor wave 3 lasted a Fibonacci 55 days, and minor wave 4 was likely to be over in a Fibonacci 5 days. So far minor wave 5 has lasted 6 days and is incomplete. A possible end may be at a Fibonacci 13 days which will be in another 7 days. If it does not end there then a further 8 days would take it to a Fibonacci 21. At each Fibonacci time duration I will look at the structure to see if it could be complete and if so we shall have an alternate wave count for that possibility.
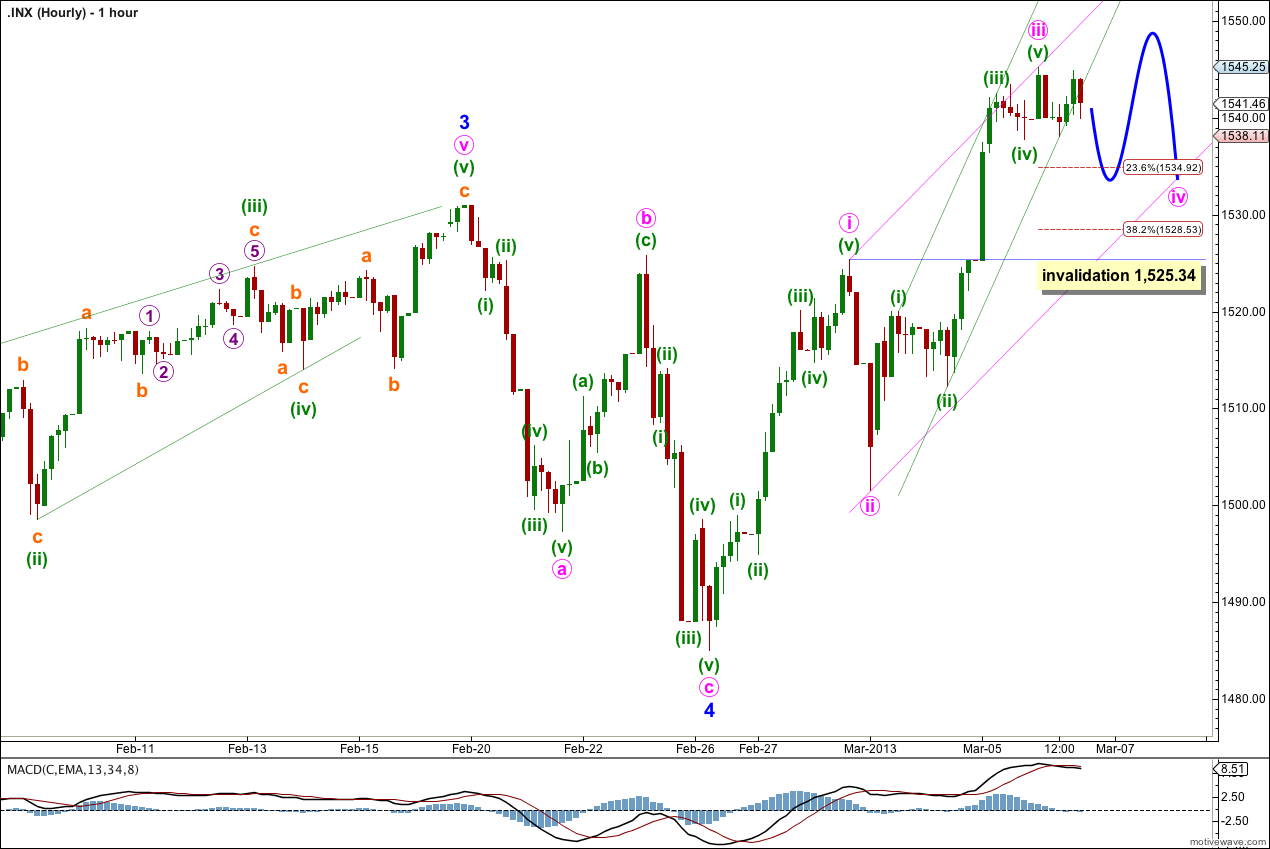
Due to the duration of minor wave 4 (a Fibonacci five days) and the overall look of this hourly wave count at this stage I think it has a higher probability than the alternate below.
If minute wave iii is over it is 3.44 points longer than equality with minute wave i.
Ratios within minute wave iii are: minuette wave (iii) is just 0.29 longer than 1.618 the length of minuette wave (i), and minuette wave (v) is 0.39 points longer than 0.382 the length of minuette wave (i).
Minute wave iii may be over during Wednesday’s session. Alternately, the fifth wave within it, minuette wave (v) could extend further. We shall have confirmation that minuette wave (v) is over when price moves below its start at 1,537.79 as at that stage downwards movement may not be just a second wave correction within minuette wave (v). Further, when the small narrow green channel about minute wave iii is breached that will provide trend channel confirmation that minute wave iii is over and minute wave iv should then be underway.
We may now draw a larger channel about minor wave 5. Draw the first trend line from the highs of minute wave i to iii, then place a parallel copy upon the low of minute wave ii. Minute wave iv may find support at the lower edge of this wider pink channel.
Minute wave ii was a deep 59% zigzag correction of minute wave i. Given the guideline of alternation we may expect minute wave iv to be a shallow sideways moving flat, triangle, combination or double flat. It may end either about 1,535 or 1,529. It should last one to three sessions.
For all of the most likely structures for minute wave iv a new high may be made. There can be no upper invalidation point for this wave count at this stage.
Minute wave iv may not move into minute wave i price territory. Movement below 1,525.34 would invalidate this wave count and confirm the alternate below.
Alternate Hourly Wave Count.
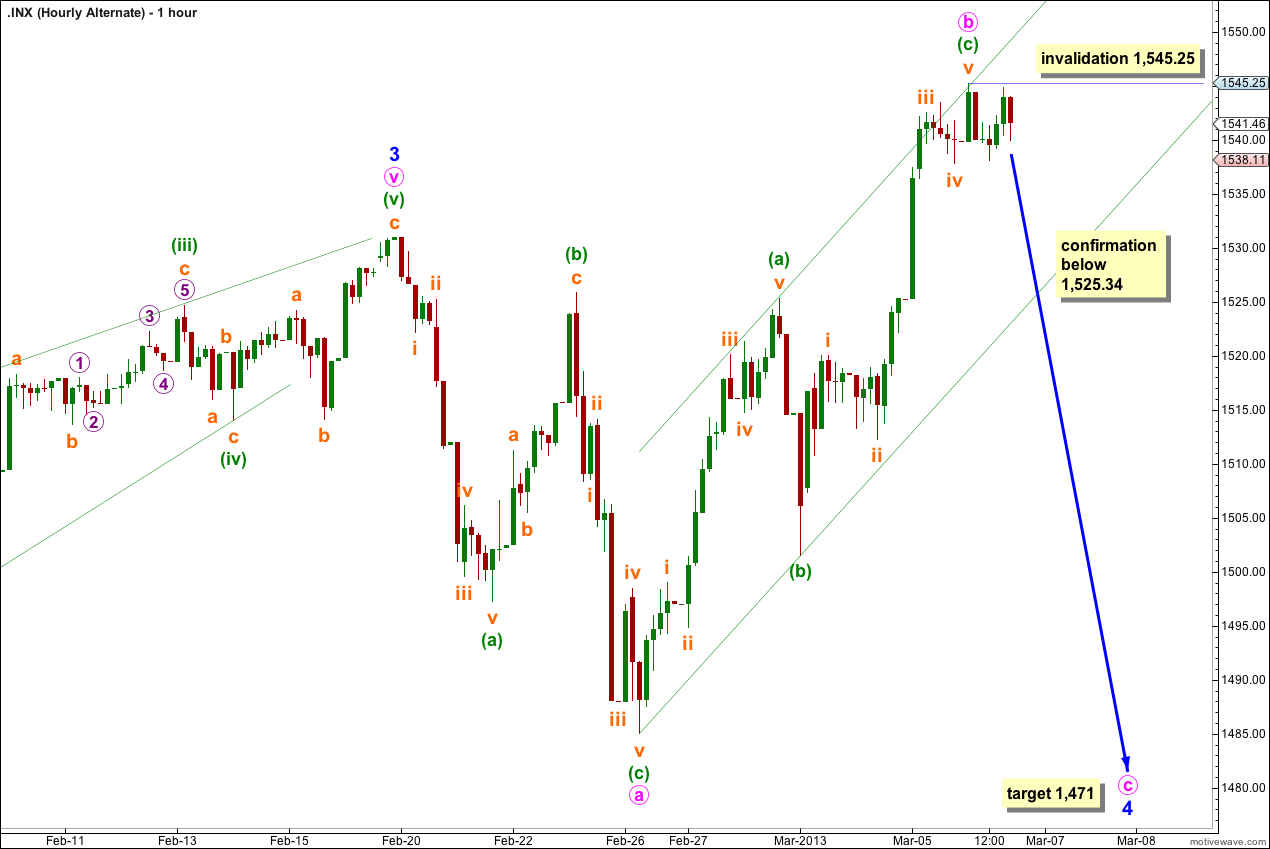
At this stage the size and duration of minor wave 4 for this alternate wave count looks too far out of proportion to its counterpart minor wave 2. This wave count now does not have as good a look as the main wave count does.
If price moves below 1,525.34 this alternate may be considered confirmed. At that stage we may expect price to continue to fall for another one or two sessions, in a five wave structure.
If this wave count is correct then minor wave 4 is unfolding as an expanded flat correction because minute wave b is a 131% correction of minute wave a. This is within the common length of B waves in relation to A waves within flats of 100 – 138%.
At 1,471 minute wave c would reach 1.618 the length of minute wave a.
Minor wave 4 may not move into minor wave 1 price territory. This wave count is invalidated with movement below 1,409.16.