
My last oil analysis was over a year ago and it expected price to move lower. Price has mostly moved sideways in a decreasing range for the last year.
My wave count at the monthly chart level is changed very little. I have a new monthly alternate.
Click on the charts below to enlarge.
Main Wave Count.
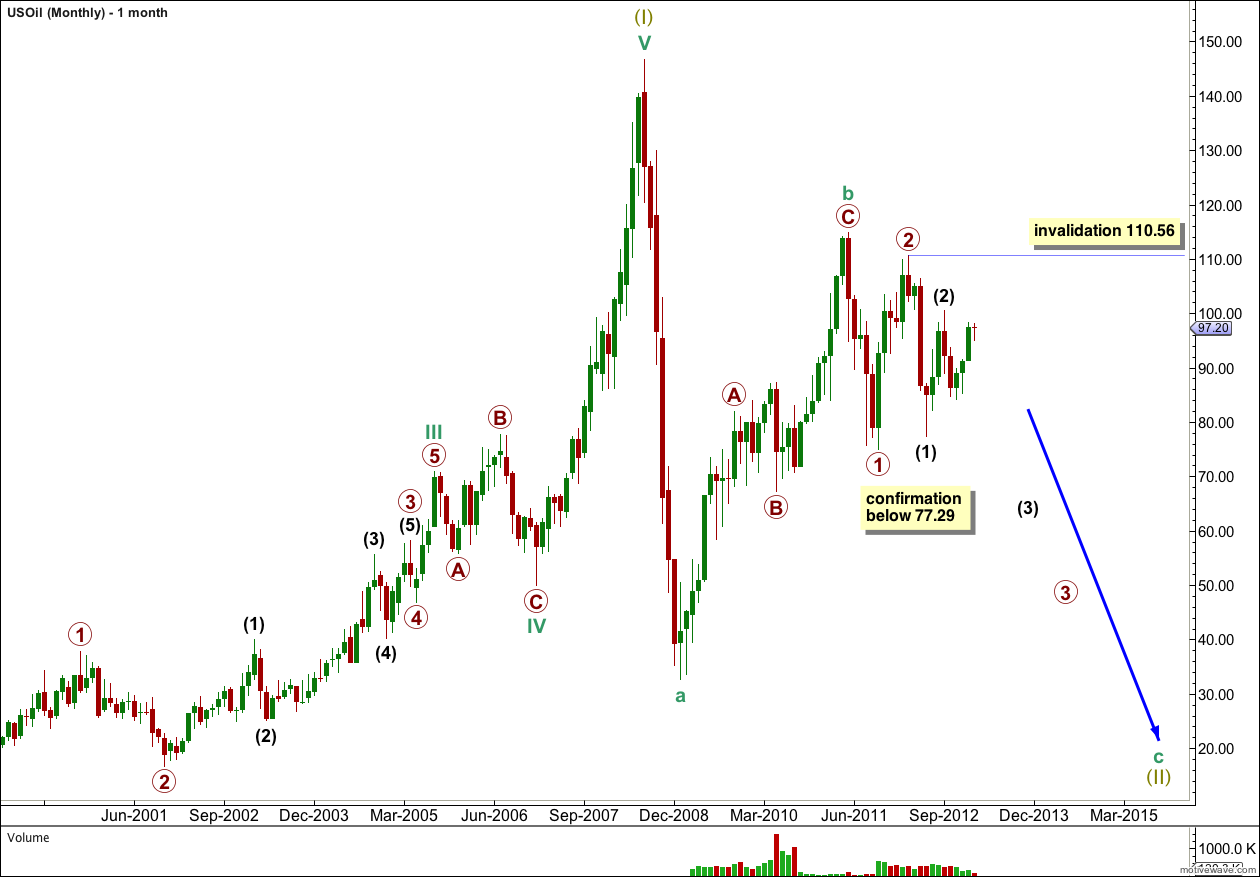
The long rise to the high of 146.73 in July 2008 looks typically impulsive, with a spike at the end typical of commodities.
This may have been the end of a first wave at super cycle degree, wave (I) (olive green).
Thereafter, the drop labeled cycle wave a (teal green) subdivides reasonably well into a five wave structure which indicates that the upwards trend is over and a new downwards trend is underway. If this is an A wave it also indicates that the downwards correction is a zigzag which rules out a new all time high in the foreseeable future.
This main wave count looks at the possibility that cycle wave b was over in just over two years as a single zigzag structure. Within cycle wave b primary wave C is just 1.64 points short of equality with primary wave A.
If cycle wave c has begun at 114.82 then it has begun with a series of overlapping first and second waves. This indicates that a strong third wave downwards should follow soon. Price movement below 77.29 would provide confirmation of this wave count as at that stage the alternate below would be invalidated.
Within this new downwards trend intermediate wave (2) may not move beyond the start of intermediate wave (1). This main wave count is invalidated with movement above 110.56.
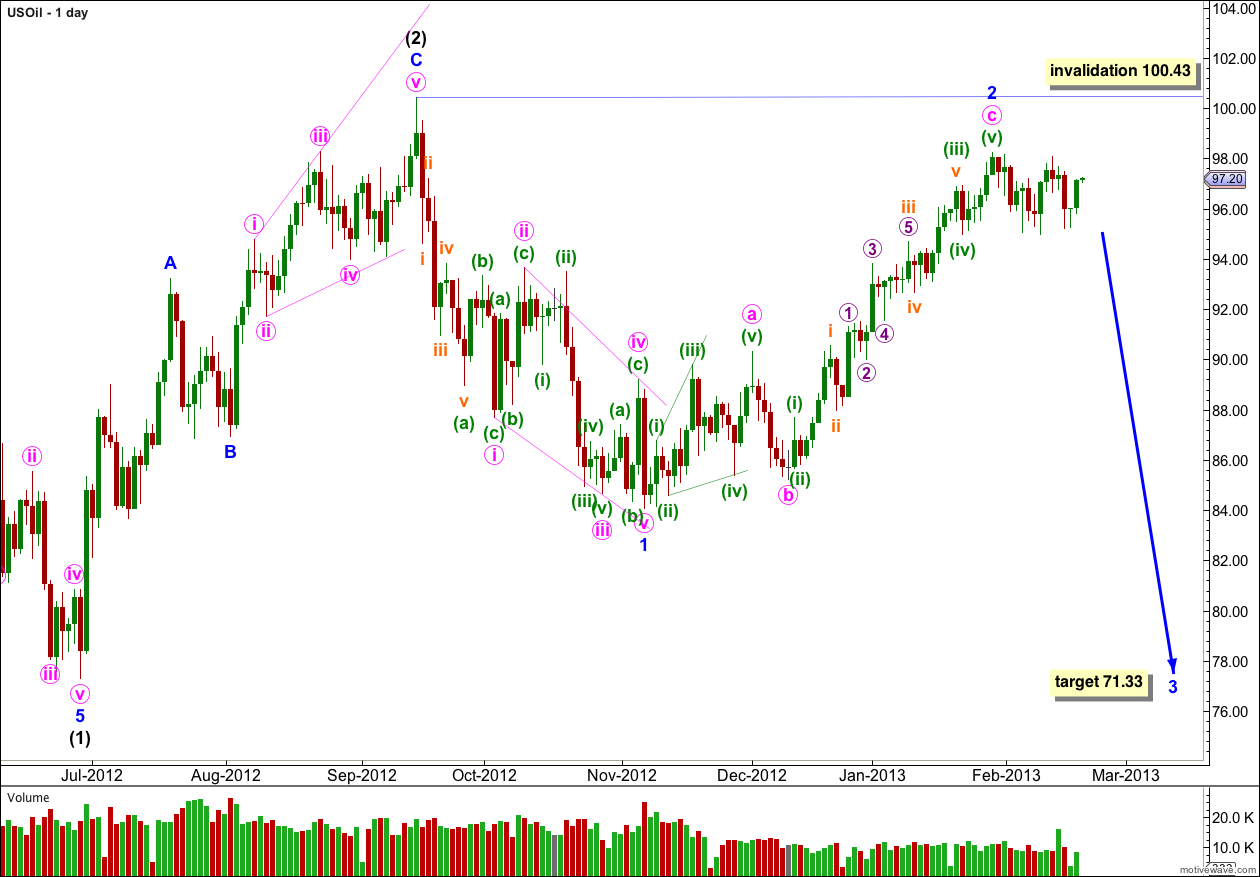
This daily chart looks at the end of intermediate wave (1) with minor waves 1 and 2 to follow it now complete.
Minor wave 1 is a leading contracting diagonal. Following a leading diagonal in a first wave position we would expect to see a very deep second wave correction. Minor wave 2 is an 87% correction of minor wave 1.
Within minor wave 2 there is no Fibonacci ratio between minute waves a and c.
Ratios within minute wave c are: minuette wave (iii) is just 0.6 points longer than 4.236 the length of minuette wave (i), and minuette wave (v) has no Fibonacci ratio to either of minuette waves (i) or (iii).
Ratios within minuette wave (iii) are: subminuette wave iii has no Fibonacci ratio to subminuette wave i, and subminuette wave v is just 0.05 short of 0.618 the length of subminuette wave iii.
Ratios within subminuette wave iii are: micro wave 3 has no Fibonacci ratio to micro wave 1, and micro wave 5 is just 0.16 short of equality with micro wave 1.
If this wave count is correct then it is extremely likely that minor wave 2 is complete. At 71.33 minor wave 3 would reach 1.618 the length of minor wave 1.
If price moves above 100.43 I may favour the alternate wave count below.
Alternate Wave Count.
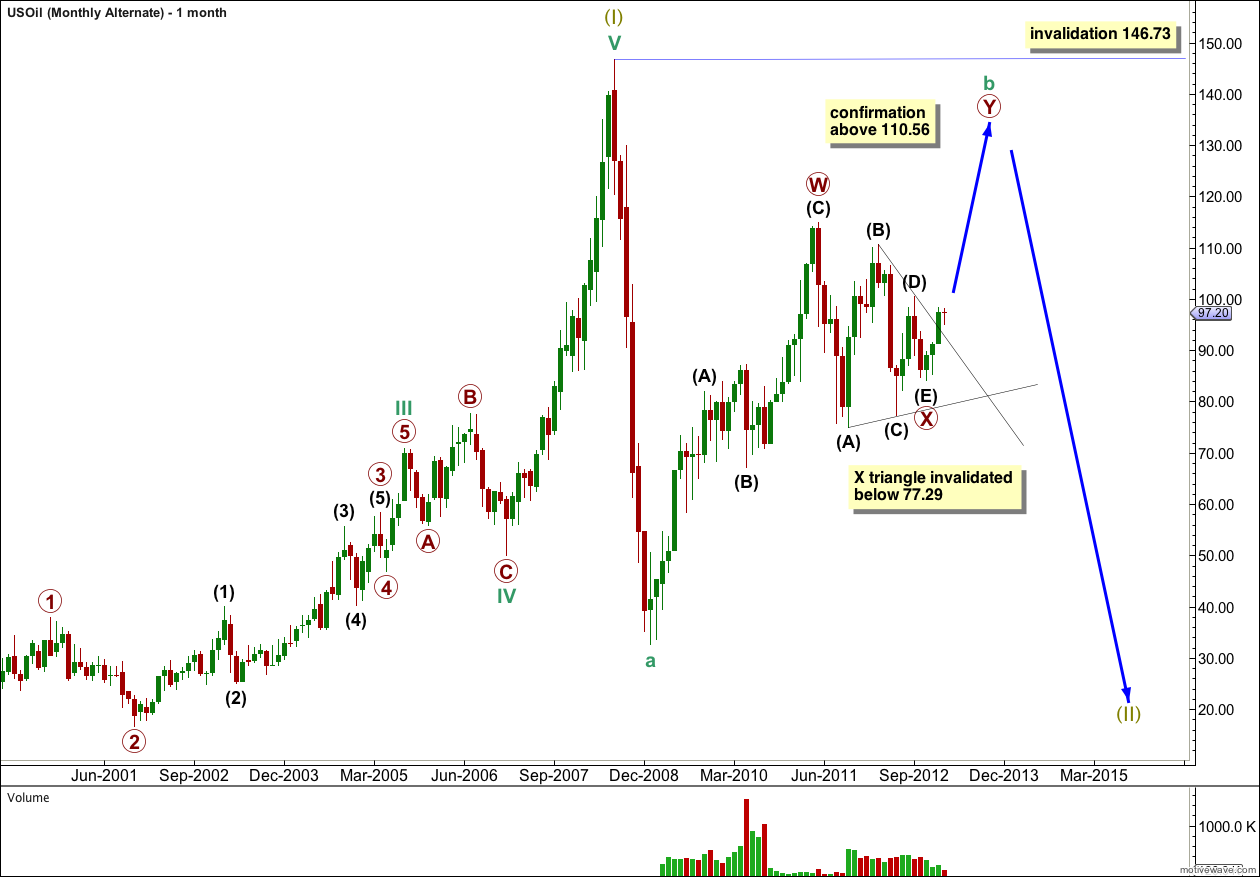
There may be a triangle forming over the last 18 months. If so it would most likely be an X wave at primary degree, because the upwards movement labeled primary wave W subdivides as a three not a five.
The triangle would be contracting. It may be over, or intermediate wave (D) or (E) may yet continue further sideways in an ever decreasing range for a while yet.
Movement above 110.56 would indicate that the triangle is complete and the following upwards thrust would be underway.
Movement below 77.29 would invalidate the triangle because intermediate wave (E) may not move beyond the end of intermediate wave (C). If the triangle is invalidated with downwards movement the main wave count above would be confirmed.
Price exits a triangle in the same direction it entered. This wave count expects an upwards thrust when the triangle is completed. The upwards thrust may travel about the same distance as the widest part of the triangle which was 39.86.
Because cycle wave a subdivides best as a five super cycle wave (II) may be a zigzag. Within the zigzag cycle wave b may not move beyond the start of cycle wave a. Movement above 146.73 to a new all time high is not expected for this wave count.