
Last week’s analysis of the Dow expected to most likely see upwards movement for the week. A new high was made and price remained above the invalidation point on the main hourly wave count.
This week I have one daily and two hourly wave counts for you.
Click on the charts below to enlarge.
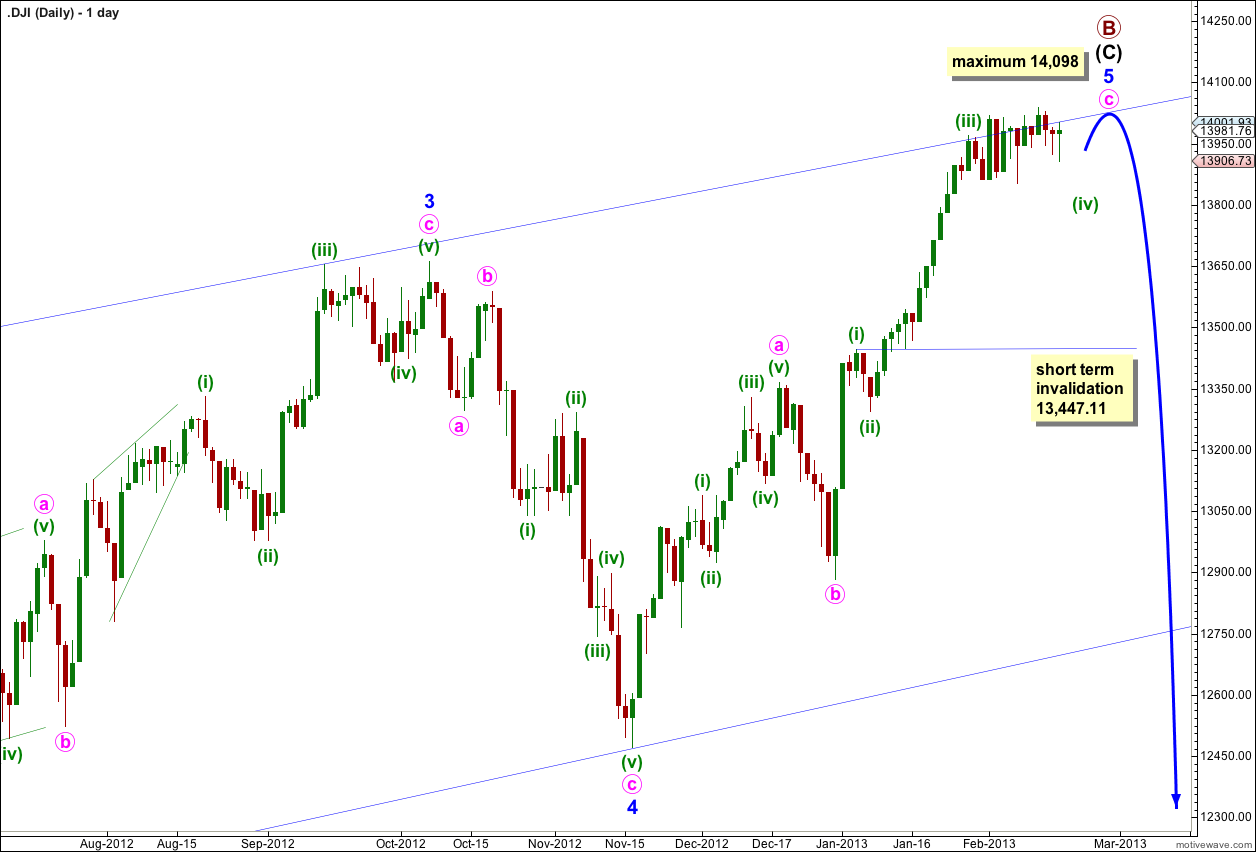
The final wave upwards, wave 5 blue, within the ending contracting diagonal of intermediate wave (C) may be very close to completion.
Because the diagonal is contracting wave 3 blue is shorter than wave 1 blue. Wave 3 may never be the shortest wave and so wave 5 blue has a maximum length of equality with wave 3 blue at 14,098.27.
Price may have found resistance at the upper trend line of the diagonal. This may be an indication of an approaching end to upwards movement.
Because this possible trend change is a large one at primary degree it is wise to wait for confirmation. We may consider movement below the lower trend line of the diagonal as confirmation of this trend change. At that stage I would calculate downwards targets. To do so prior to confirmation would be premature.
Main Hourly Wave Count.
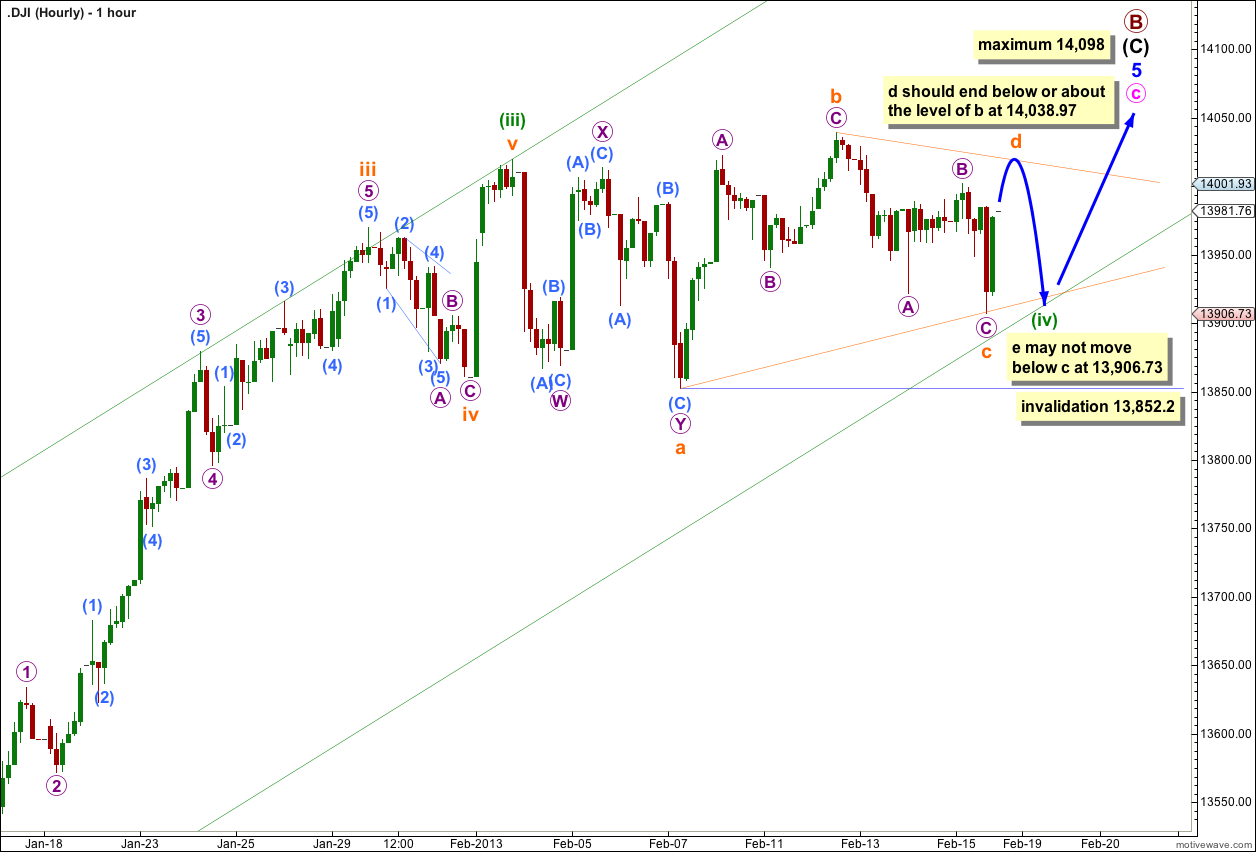
I have considered several possibilities for last week’s movement. Because each wave subdivides into a three or a double three it looks most like this is wave (iv) green continuing to move sideways.
Within this sideways movement each wave subdivides into a zigzag, and there are no flat corrections in here. This fits as a triangle. It is unlikely to be a triple zigzag (which I have considered) as although the subdivisions fit the behaviour does not. The purpose of double and (rare) triple zigzags is to deepen a correction. Price is moving sideways, not lower, so a triple zigzag does not make sense.
I am wary of labeling triangles before completion because invariably in my experience the triangle invalidates itself and the structure turns out to be a combination. If price moves below 13,852.2 next week then I expect downwards movement would be a C wave of a flat for wave (iv) green which is detailed in the alternate hourly wave count below.
If price remains below 14,038.97 (or at least does not move much above this point) and does not move below 13,852.20 then a triangle will remain valid.
A contracting triangle requires wave c to not move beyond the end of wave a. This triangle is invalidated with movement below 13,852.2.
A contracting triangle requires wave d to not move beyond the end of wave b above 14,038.97. A barrier triangle would see wave d orange end about the same level as wave b orange so that the b-d trend line is essentially flat. In practice this means wave d orange could end very slightly above the end of wave b orange at 14,038.97.
Thereafter wave e orange may not move beyond the end of wave c orange which may have ended at 13,906.73.
If the triangle remains valid then we may expect wave (v) green to move price sharply upwards and travel about 168 points.
Alternate Hourly Wave Count.
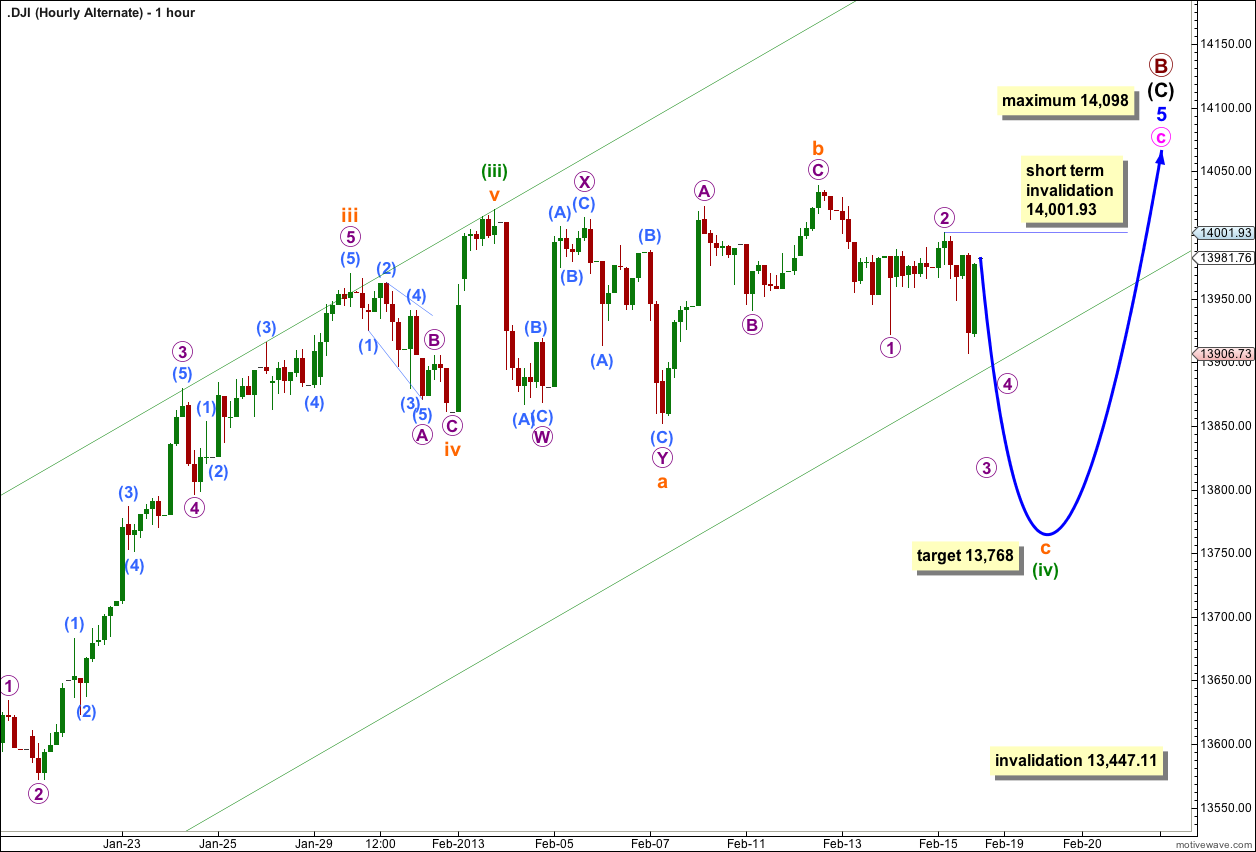
If the triangle is invalidated with movement below 13,852.2 then we may use this alternate wave count.
It is possible that wave (iv) green is completing as an expanded flat correction.
Within it wave a orange may be a double zigzag, wave b orange a single zigzag, and wave c orange would be unfolding as an impulse or possibly an ending diagonal if we see wave 1 purple as a zigzag.
Wave b orange was a 111% correction of wave a orange.
At 13,768 wave c orange would reach 1.618 the length of wave a orange.
Within wave 3 purple of wave c orange no second wave correction may move beyond the start of the first wave. This alternate is invalidated with movement above 14,001.93.