
Last week’s analysis had two wave counts which expected different directions. However, price moved sideways and invalidated both wave counts without giving us clarity.
At this stage I have three hourly wave counts for you.
Click on the charts below to enlarge.
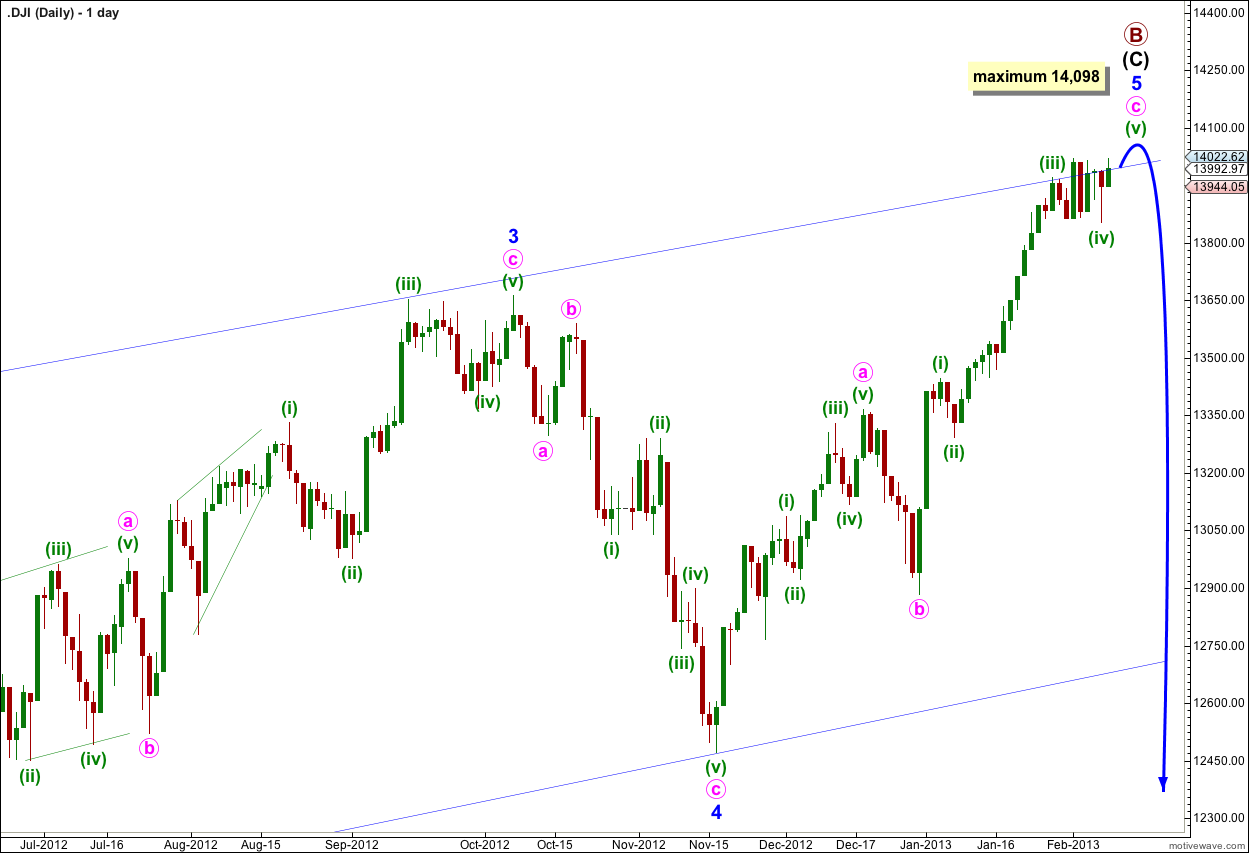
The final wave upwards, wave 5 blue, within the ending contracting diagonal of intermediate wave (C) may be very close to completion, or it again may be possibly complete (second alternate hourly wave count below).
Because the diagonal is contracting wave 3 blue is shorter than wave 1 blue. Wave 3 may never be the shortest wave and so wave 5 blue has a maximum length of equality with wave 3 blue at 14,098.27.
Price may have found resistance at the upper trend line of the diagonal. This may be an indication of an end to upwards movement.
Because this possible trend change is a large one at primary degree it is wise to wait for confirmation. We may consider movement below the lower trend line of the diagonal as confirmation of this trend change. At that stage I would calculate downwards targets. To do so prior to confirmation would be premature.
Main Hourly Wave Count.
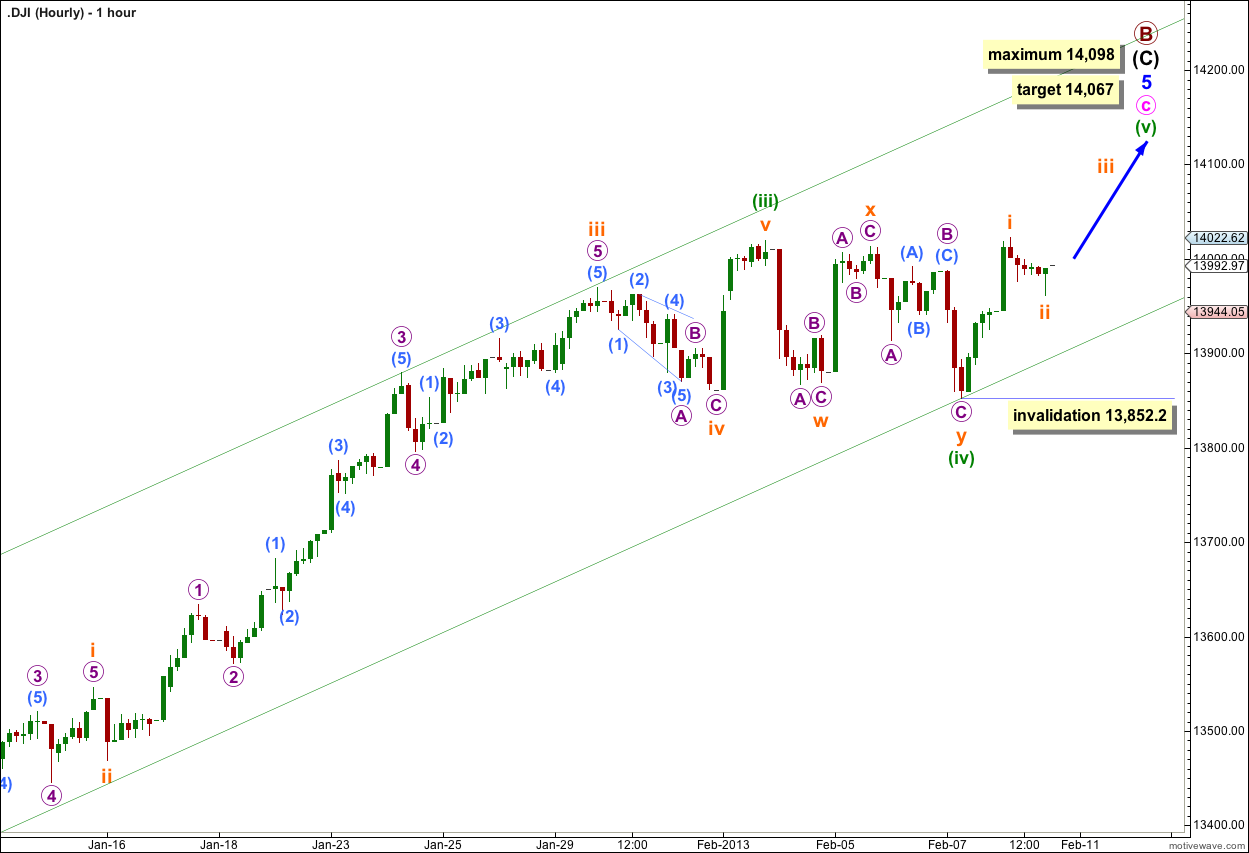
Wave (iv) green may be complete as a double combination structure: zigzag – X – flat.
Within wave (v) green, the very last upwards movement, wave i orange may be complete.
I have redrawn the parallel channel using Elliott’s second technique. The first trend line is drawn from the lows of waves (ii) to (iv) green, then a parallel copy is placed upon the high of wave (iii) green. This channel very nicely contains upwards movement which is a slight indication that this main wave count may be correct.
At 14,067 wave (v) green would reach 0.382 the length of wave (i) green.
Wave ii orange may not move beyond the start of wave i orange. This wave count is invalidated with movement below 13,852.20.
Alternate Hourly Wave Count.
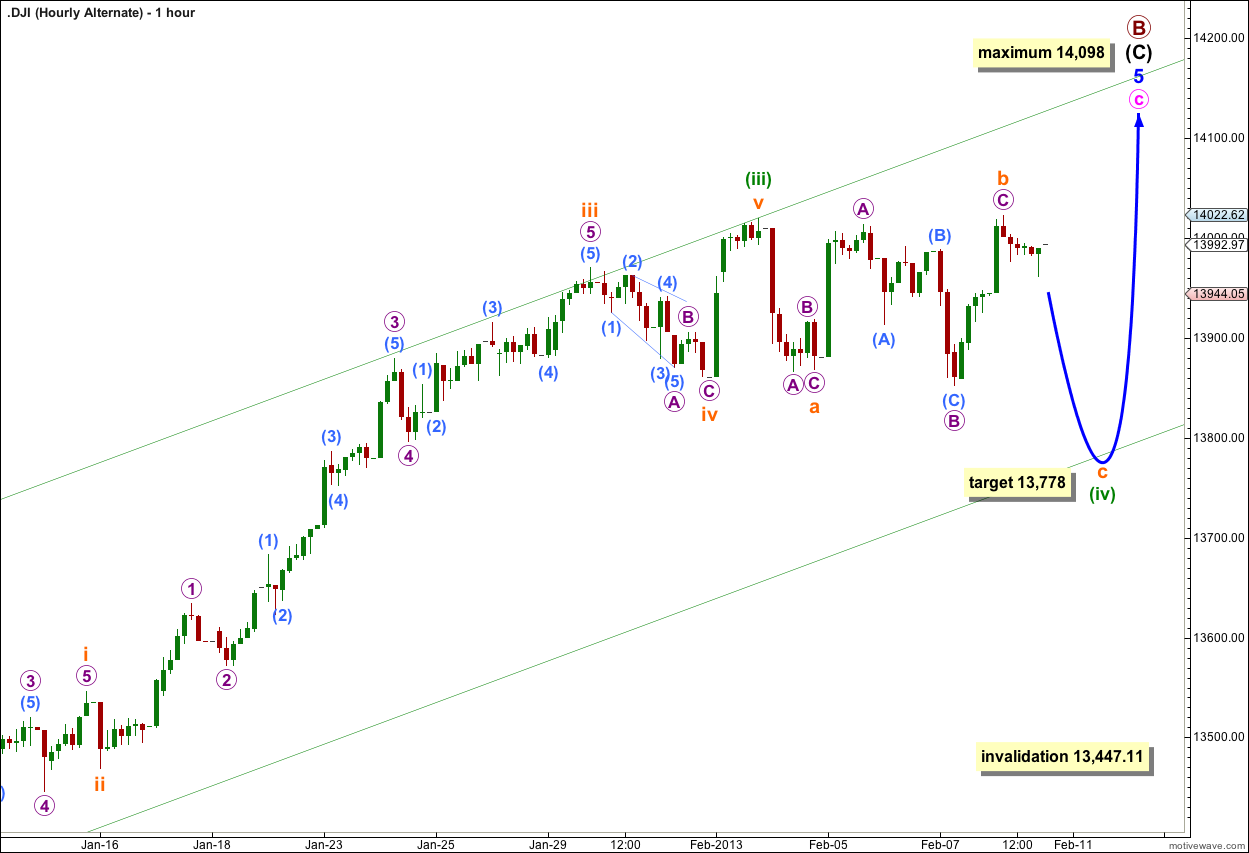
This wave count is identical to the main hourly wave count up to the high labeled wave (iii) green. I have moved the labeling within wave (iv) green down one degree.
Wave (iv) green may be an incomplete flat correction. At 13,778 wave c orange would reach 1.618 the length of wave a orange.
Wave (iv) green may not move into wave (i) green price territory. This wave count is invalidated with movement below 13,447.11.
Second Alternate Hourly Wave Count.
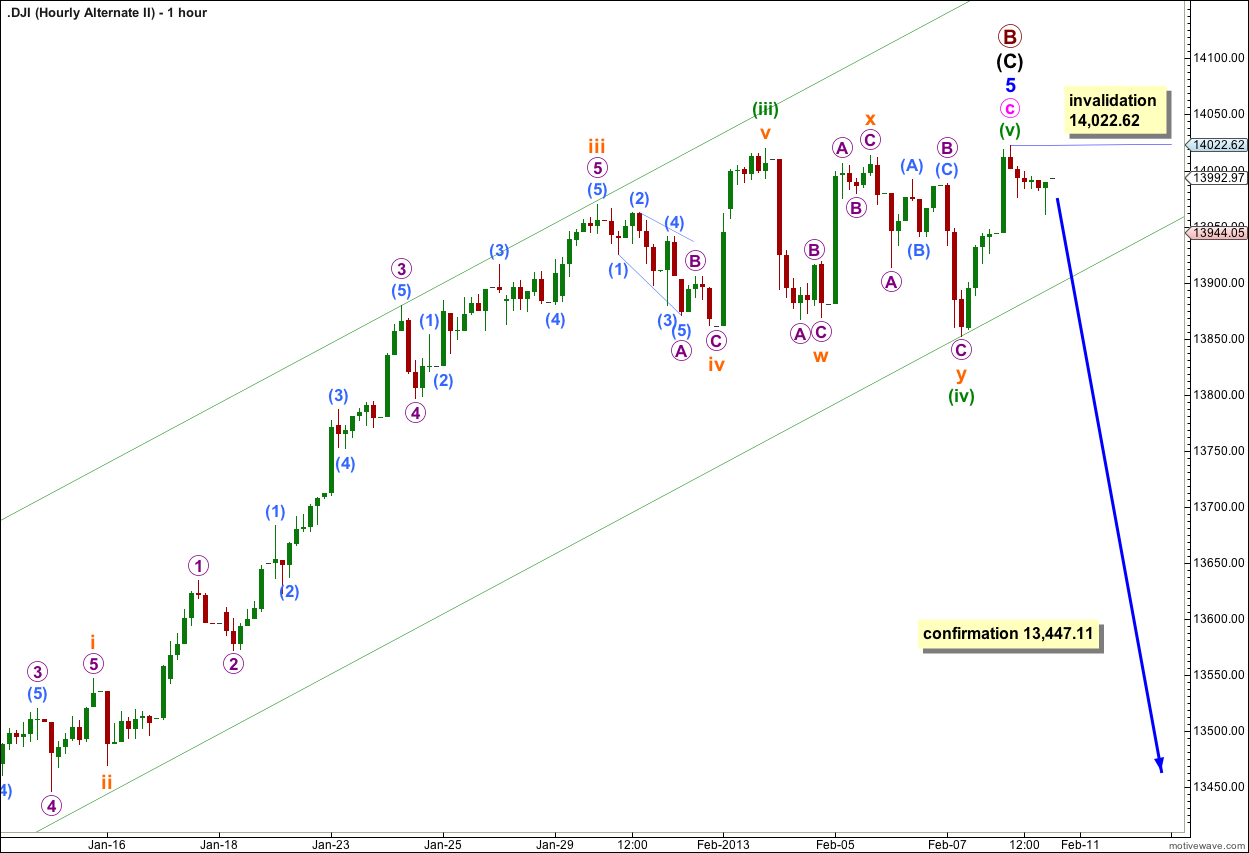
This second alternate is the same as the main wave count up to the low labeled wave (iv) green. Thereafter, I have moved the degree of labeling within wave (v) green up one degree.
It is possible that primary wave B in its entirety is over.
However, this alternate has the lowest probability because of the brevity of wave (v) green.
Within wave c pink there is no Fibonacci ratio between waves (i) and (iii) green, and wave (v) green here is just 1.05 points longer than 0.236 the length of wave (iii) green.
Movement below 13,447.11 would invalidate the first alternate wave count and provide some confirmation that this second alternate may be correct. However, movement below the lower edge of the trend line for the ending diagonal on the daily chart would be required to have a good level of confidence in a trend change at primary degree.