
Yesterday’s analysis had two hourly wave counts. Price has moved lower as the alternate hourly wave count expected, although it did not reach down to the target. Price has remained above the invalidation point on the main hourly wave count and so both wave counts remain valid.
Today, they both expect the same direction for tomorrow’s session. In coming sessions they will again diverge and I will continue with both wave counts.
The daily wave count and target are unchanged today.
Click on the charts below to enlarge.
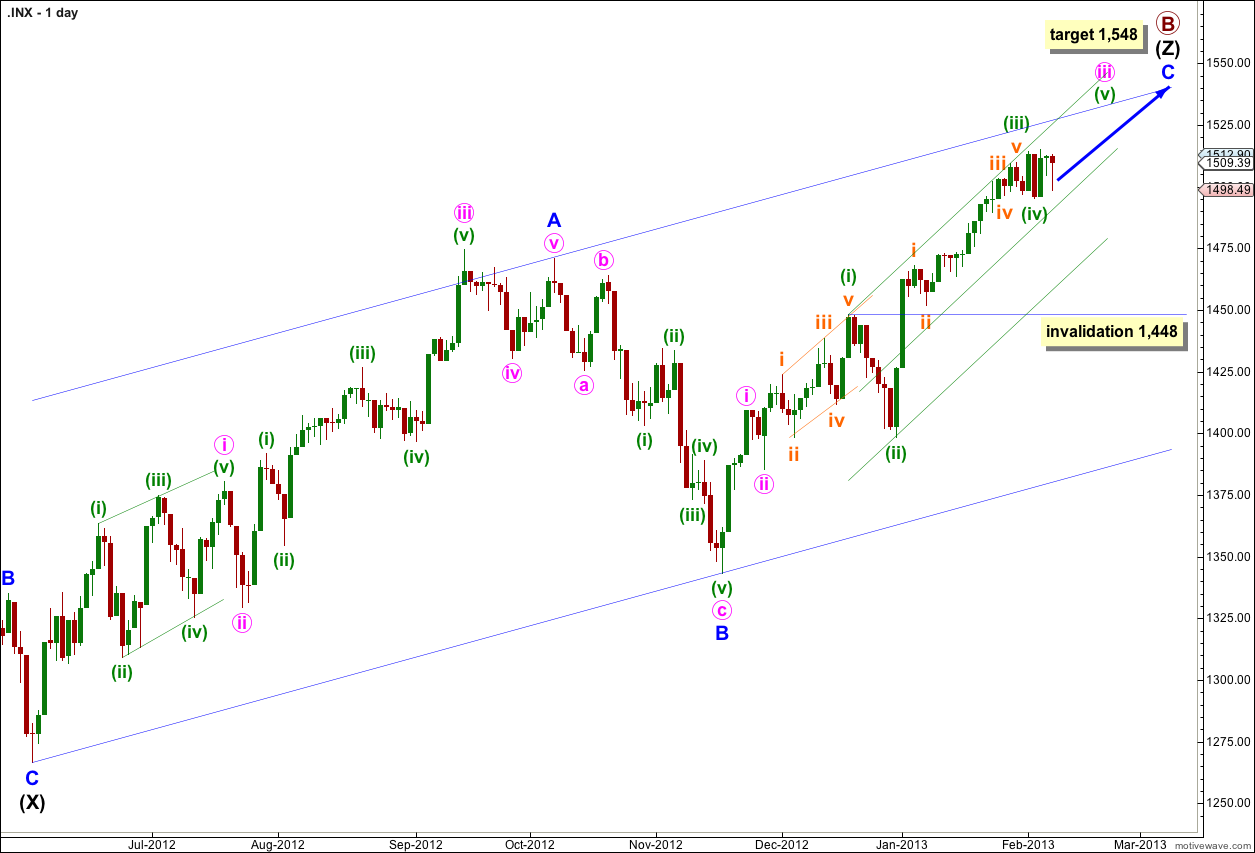
The structure for primary wave B is a triple zigzag. Because three is the maximum number of structures within a multiple when this third zigzag is finally complete then the entire correction for primary wave B must be complete. There is no other Elliott wave structure which could allow for upwards movement within this wave count at cycle degree.
Wave (Z) black is incomplete as an exaggerated zigzag, wave C blue within it is incomplete.
Within wave iii pink of wave C blue there are some interesting Fibonacci time relationships: wave (i) green lasted 14 days (one more than a Fibonacci 13), wave (ii) green lasted a Fibonacci 8 days, wave (iii) green lasted 20 days (one less than a Fibonacci 21) and wave (iv) green may have been over in a Fibonacci 3 days.
At 1,548 wave C blue would reach equality with wave A blue. At that point primary wave B would be a 166% correction of primary wave A. This target may be too high. When waves iii and iv pink are complete I will recalculate the target based upon pink wave degree.
I have used Elliott’s channeling technique to draw a channel about wave (Z) black zigzag. Price may find resistance at the upper edge of the channel.
Within wave iii pink wave (iv) green may not move into wave (i) green price territory. This wave count is invalidated with movement below 1,448.
I have drawn a double wide channel about wave iii pink: draw the first trend line from the highs of waves (i) to (iii) green then place a parallel copy upon the low of wave (ii) green. Place a second parallel copy mid way within the channel. Price may remain within the upper half of the channel and may find resistance at the upper trend line.
Main Hourly Wave Count.
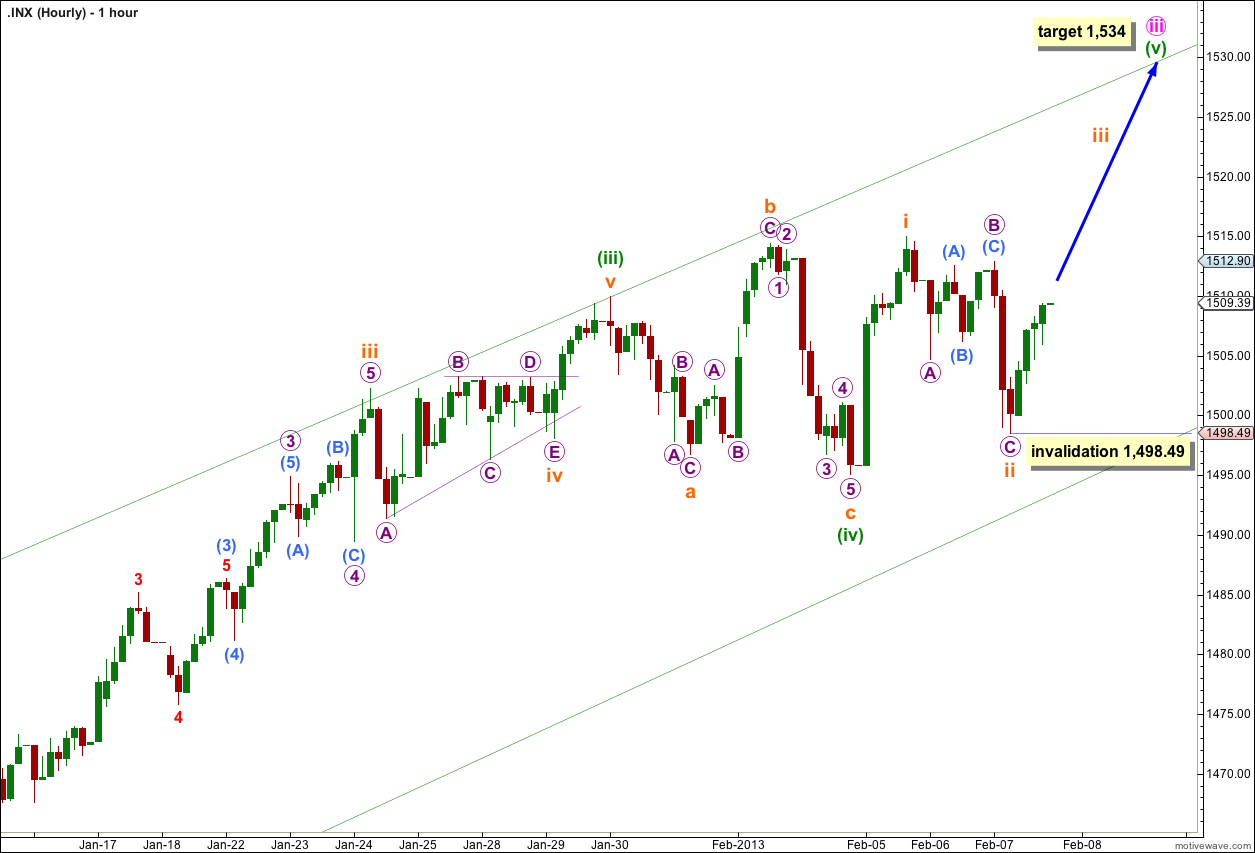
This wave count now has a slightly better look than the alternate despite downwards movement during Thursday’s session.
Wave ii orange has now lasted 13 hours which is very close to the same duration of waves ii and iv orange within wave (iii) green at 12 and 23 hours respectively. The proportion of wave ii orange looks right and fits nicely.
If this wave count is correct then upwards movement should increase in momentum tomorrow.
At 1,534 wave (v) green would reach 0.618 the length of wave (i) green.
So far wave (v) green may have lasted three sessions. If it continues for another five sessions it would have lasted a Fibonacci eight. If it continues for another ten sessions it would have lasted a Fibonacci thirteen. Thirteen sessions may be more likely as then it would be close in equality to wave (i) green which lasted fourteen sessions.
When waves iii and iv orange within wave (v) green are complete I will calculate a target for wave (v) green to end based upon orange degree, so the target may change.
Within wave iii orange no second wave correction may move beyond the start of its first wave. This wave count is invalidated with movement below 1,498.49.
Alternate Hourly Wave Count.
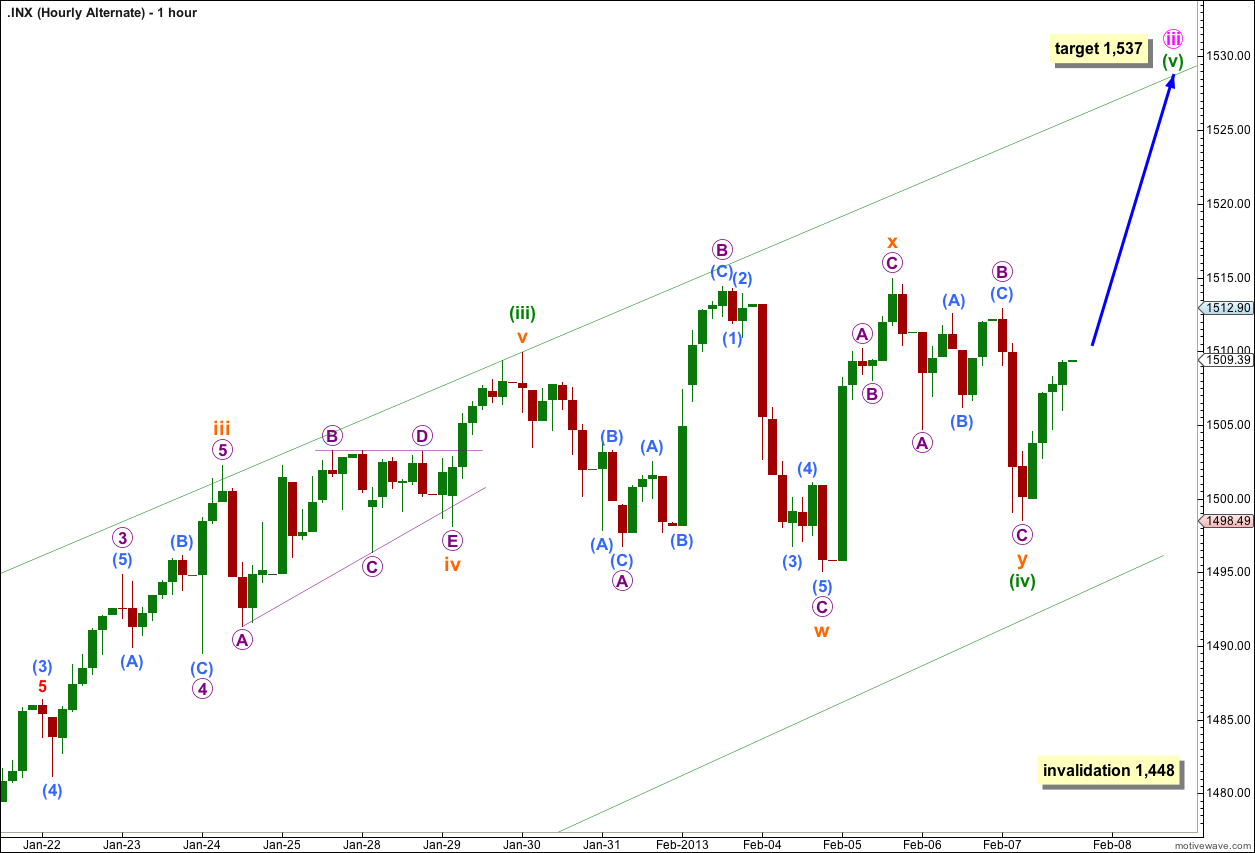
For the alternate hourly wave count wave (iv) green may now be over not as a double flat but as a double combination correction: flat – X – zigzag.
Alternatively, wave (iv) green may continue yet further sideways as a triple. This is possible but has a very low probability due to the rarity of triples.
At 1,537 wave (v) green would reach 0.618 the length of wave (i) green.
If wave (iv) green does continue further it may not move into wave (i) green price territory. This wave count is invalidated with movement below 1,448.