
Last analysis expected more upwards movement from the S&P 500 towards a target at 1,518 to 1,519. Price has risen during Friday’s session as expected, and the target is not yet met.
The structure on the hourly chart looks very typical and price remains well within the parallel channel.
The wave count is the same with just the one daily and one hourly chart for you to end the week.
Click on the charts below to enlarge.
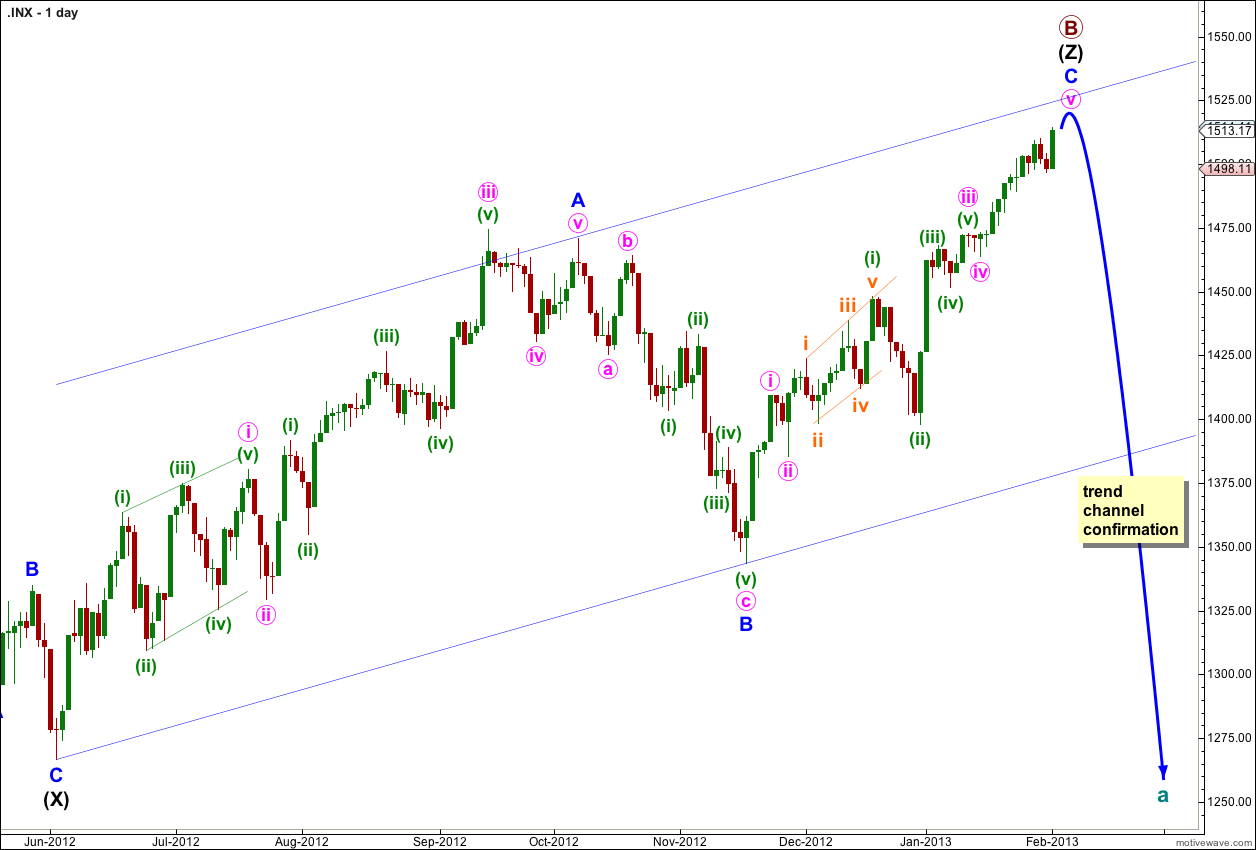
The structure for primary wave B is a triple zigzag, and price is now within the third zigzag in the triple labeled wave (Z) black. Because three is the maximum number of structures within a multiple when this third zigzag is finally complete then the entire correction for primary wave B must be complete. There is no other Elliott wave structure which could allow for upwards movement within this wave count at cycle degree.
Wave (Z) black may now be almost complete as an exaggerated zigzag.
Wave A blue must be truncated to subdivide into a five wave structure.
If primary wave B reaches twice the length of primary wave A at 1,644 although the wave count is not technically invalidated at that point the probability would be so low it should be discarded. At that stage I would switch the monthly wave count to the alternate expanding triangle wave count, which requires a new all time high.
Wave A blue lasted 87 days (2 short of a Fibonacci 89). Wave B blue lasted 28 days. So far wave C blue has lasted 51 days. It may continue for another 4 sessions to last a Fibonacci 55 days (give or take one or two days either side of this).
I have used Elliott’s channeling technique to draw a channel about wave (Z) black zigzag. When this channel is breached by downwards movement we shall have trend channel confirmation of a trend change.
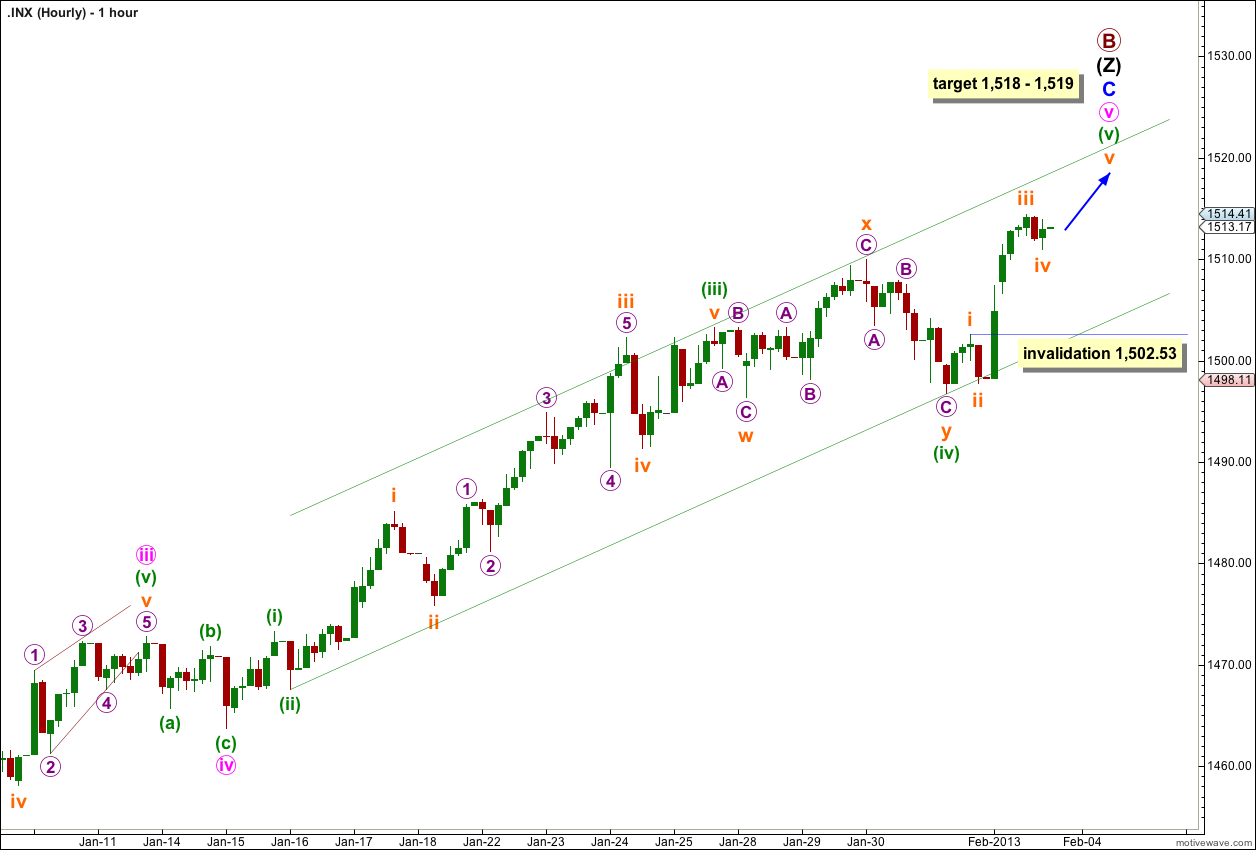
Within wave (v) green the structure looks like it is unfolding as a very typical looking impulse with waves i through to iv orange complete.
Within wave (v) green wave iii orange is 1.59 points longer than 2.618 the length of wave i orange. At 1,517 wave v orange would reach equality in length with wave i orange. For this reason I favour the lower end of the one point target zone.
At 1,519 wave (v) green would reach 0.618 the length of wave (iii) green. At 1,518 wave v pink would reach 0.618 the length of wave iii pink.
Within wave (v) green wave iv orange may not move into wave i orange price territory. This wave count is invalidated with movement below 1,502.53.
The parallel channel is drawn using Elliott’s second technique: draw the first trend line from the lows of waves (ii) to (iv) green, then place a parallel copy upon the high of wave (iii) green. Upwards movement may find resistance at the upper edge of the channel. When the channel is clearly breached by downwards movement then we shall have a very early indication that we may have seen a trend change.
To confirm the trend change is a big one at primary degree we must see a breach of the parallel channel on the daily chart. Only then will I calculate downwards targets for you. To do so prior to confirmation would be premature.