
The main wave count from last analysis expected more upwards movement for the session (after a small dip down) while the alternate expected downwards movement. At this stage it is too early to decide which wave count is correct and so we should assume the trend remains the same, until proven otherwise. “The trend is your friend.”
I have the same wave counts as yesterday with a slight adjustment to the main hourly wave count.
Click on the charts below to enlarge.
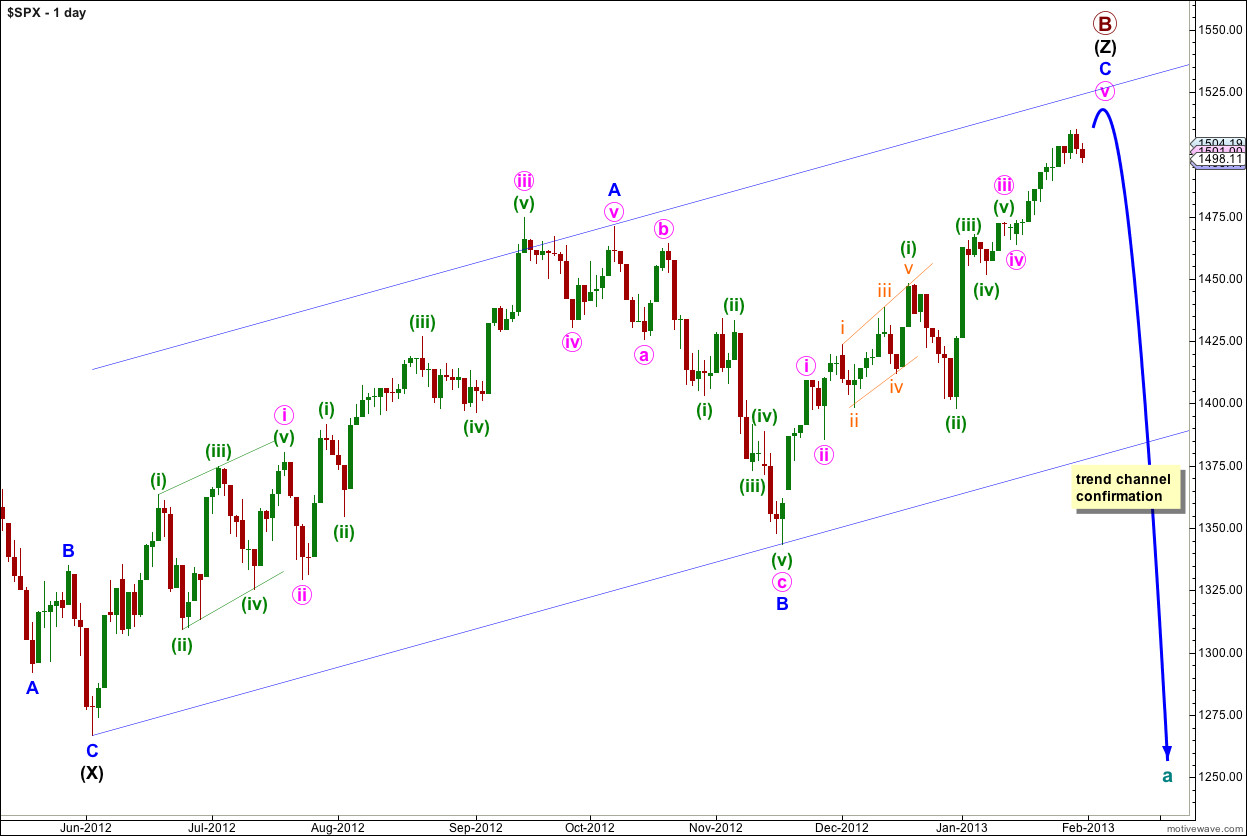
The structure for primary wave B is a triple zigzag, and price is now within the third zigzag in the triple labeled wave (Z) black. Because three is the maximum number of structures within a multiple when this third zigzag is finally complete then the entire correction for primary wave B must be complete. There is no other Elliott wave structure which could allow for upwards movement within this wave count at cycle degree.
Wave (Z) black may now be almost complete as an exaggerated zigzag.
Wave A blue must be truncated to subdivide into a five wave structure.
If primary wave B reaches twice the length of primary wave A at 1,644 although the wave count is not technically invalidated at that point the probability would be so low it should be discarded. At that stage I would switch the monthly wave count to the alternate expanding triangle wave count, which requires a new all time high.
Wave A blue lasted 87 days (2 short of a Fibonacci 89). Wave B blue lasted 28 days. So far wave C blue has lasted 50 days. It may continue for another 5 sessions to last a Fibonacci 55 days.
I have used Elliott’s channeling technique to draw a channel about wave (Z) black zigzag. When this channel is breached by downwards movement we shall have trend channel confirmation of a trend change.
Main Hourly Wave Count.
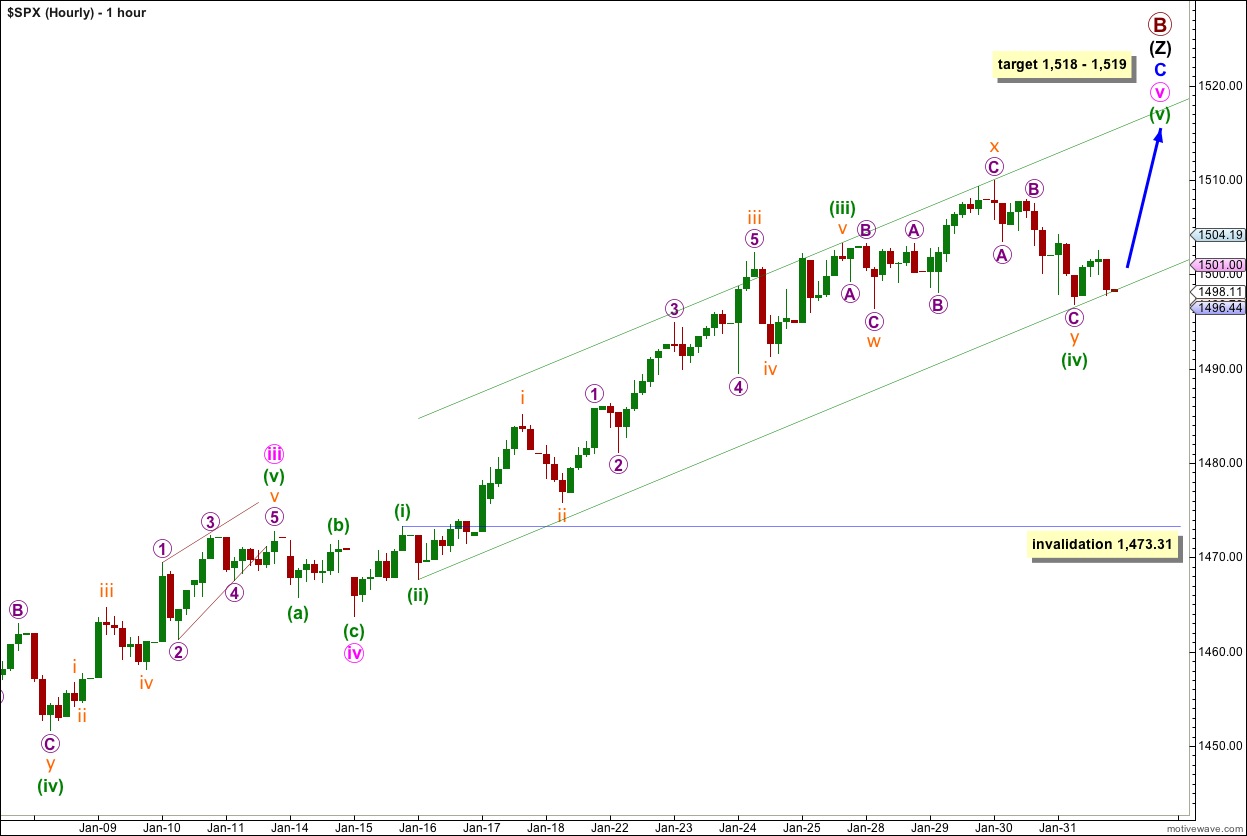
It is possible that downwards movement during the last two sessions is an extension of wave (iv) green. However, at the hourly chart level this wave count is starting to have an odd look because the proportions of waves (ii) and (iv) green are so different.
The channel has been redrawn. The first trend line is drawn from the lows of waves (ii) to (iv) green, then a parallel copy is placed upon the high of wave (iii) green.
The target has been slightly recalculated. At 1,519 wave (v) green would reach 0.618 the length of wave (iii) green. At 1,518 wave v pink would reach 0.618 the length of wave iii pink.
If wave (iv) green extends further as a triple, or wave C purple of wave y orange moves lower, it may not move into wave (i) green price territory. This wave count is invalidated with movement below 1,473.31.
Alternate Hourly Wave Count.
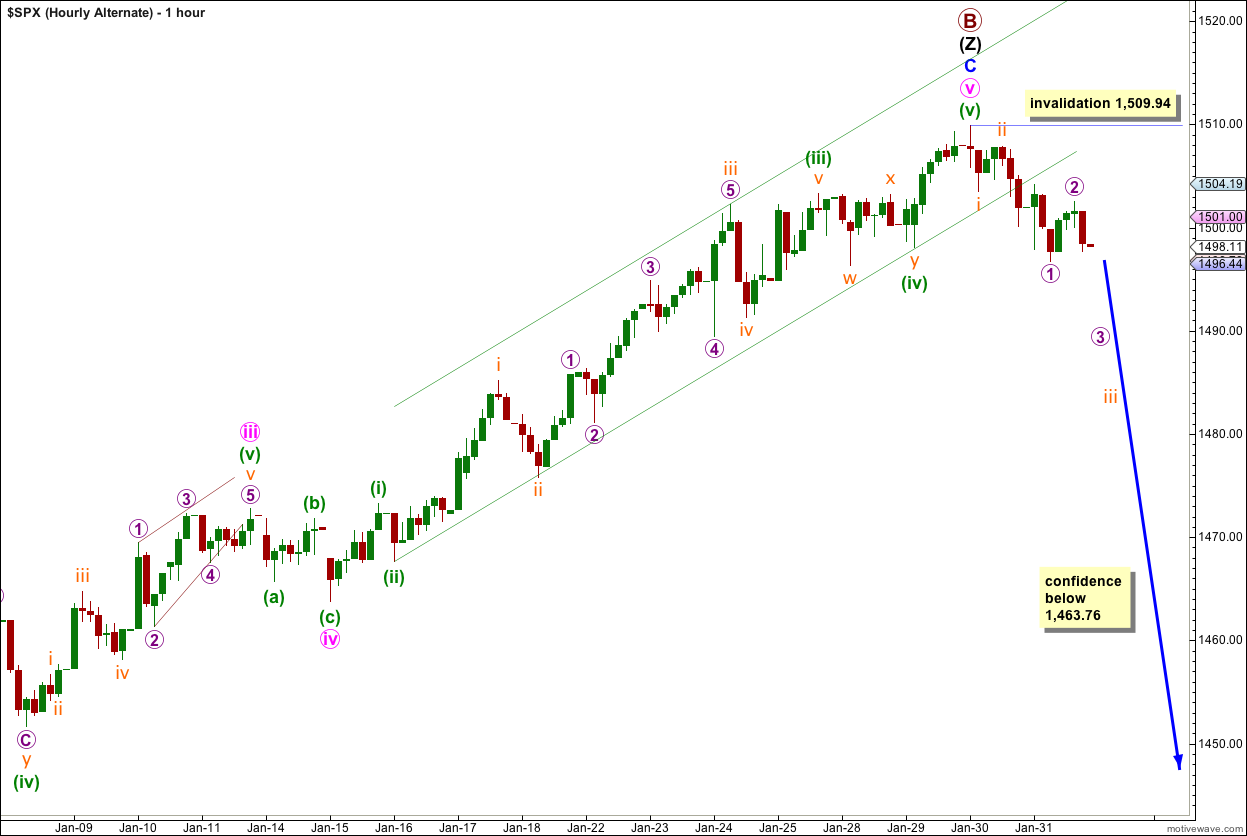
If primary wave B has ended then so far we have two overlapping first and second waves downwards. This indicates that the next movement should be downwards with an increase in momentum.
Primary wave B would be a 153% correction of primary wave A. Wave C blue has no Fibonacci ratio to wave A blue. Within wave C blue there are no Fibonacci ratios between waves i, iii and v pink. Within wave v pink there are no Fibonacci ratios between green waves (i), (iii) and (v). But green wave (v) does end mid-way within the parallel channel, and the channel is now breached.
Any movement above 1,509.94 would immediately invalidate this wave count.
Movement below the parallel channel on the daily chart is required for confidence in a trend change of this size.