
Last analysis expected more upwards movement from the S&P 500 for Wednesday’s session. Price has moved lower but remains within the allowable limit, above the invalidation point on the hourly chart.
The wave count remains the same. I have an alternate hourly wave count for you today.
Click on the charts below to enlarge.

The structure for primary wave B is a triple zigzag, and price is now within the third zigzag in the triple labeled wave (Z) black. Because three is the maximum number of structures within a multiple when this third zigzag is finally complete then the entire correction for primary wave B must be complete. There is no other Elliott wave structure which could allow for upwards movement within this wave count at cycle degree.
Wave (Z) black may now be almost complete as an exaggerated zigzag.
Wave A blue must be truncated to subdivide into a five wave structure.
If primary wave B reaches twice the length of primary wave A at 1,644 although the wave count is not technically invalidated at that point the probability would be so low it should be discarded. At that stage I would switch the monthly wave count to the alternate expanding triangle wave count, which requires a new all time high.
Wave A blue lasted 87 days (2 short of a Fibonacci 89). Wave B blue lasted 28 days. So far wave C blue has lasted 49 days. It may continue for another 6 sessions to last a Fibonacci 55 days.
I have used Elliott’s channeling technique to draw a channel about wave (Z) black zigzag. When this channel is breached by downwards movement we shall have trend channel confirmation of a trend change.
Main Hourly Wave Count.
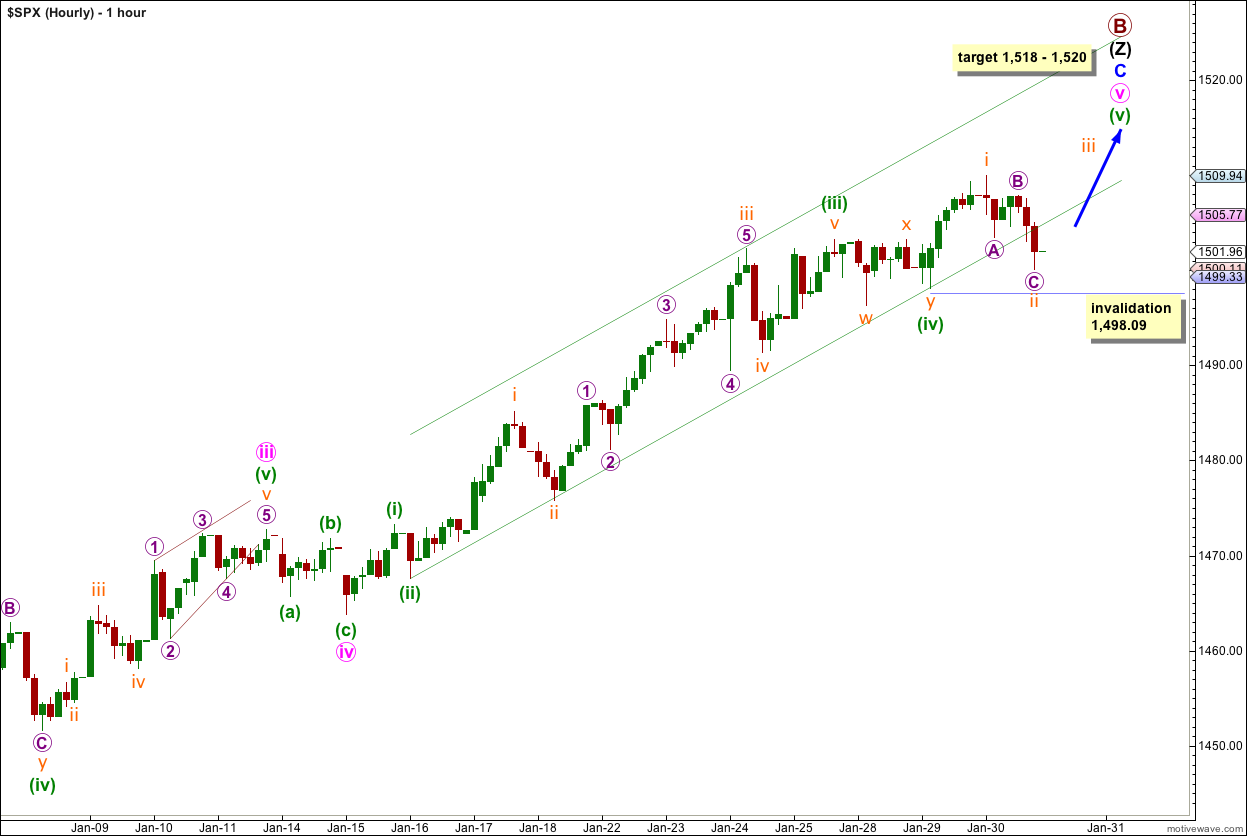
If wave (v) green is extending then downwards movement for Wednesday’s session would be wave ii orange within it.
The target remains the same. At 1,520 wave (v) green would reach 0.618 the length of wave (iii) green. At 1,518 wave v pink would reach 0.618 the length of wave iii pink.
The only small cause for concern today would be the breach of the channel containing wave v pink. This may be a very early indication of a trend change, or it may just be that this final fifth wave is so weak it is not going to be contained by the normal channel. Channels are a guideline for support and resistance and an indication of trend changes, but they are not always definitive.
On the hourly chart wave C purple of wave ii orange does not look like it is complete. It is unfolding as an impulse and requires a little more downwards movement which should begin at the start of tomorrow’s session.
Wave ii orange may not move beyond the start of wave i orange. This wave count is invalidated with movement below 1,498.09.
If this wave count is invalidated we may consider the alternate below. However, we would need to see a breach of the channel on the daily chart to have a high level of confidence in a big trend change at primary degree.
Alternate Hourly Wave Count.
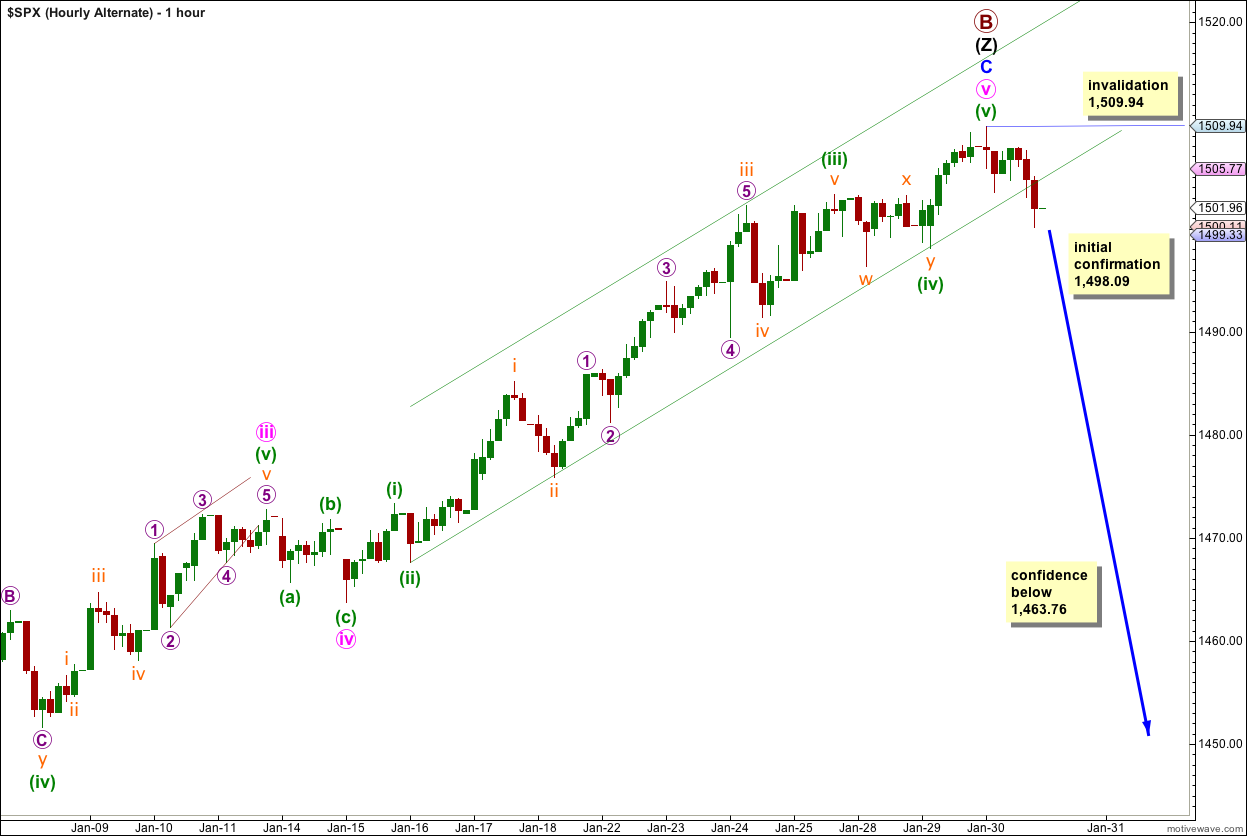
It is possible that the structure for wave (v) green is complete.
Primary wave B would be a 153% correction of primary wave A. Wave C blue has no Fibonacci ratio to wave A blue. Within wave C blue there are no Fibonacci ratios between waves i, iii and v pink. Within wave v pink there are no Fibonacci ratios between green waves (i), (iii) and (v). But green wave (v) does end mid-way within the parallel channel, and the channel is now breached.
Any movement above 1,509.94 would immediately invalidate this wave count.
Movement below 1,498.09 is an initial indication that this wave count could be correct, but it does not give confidence in a trend change.
Movement below 1,463.76 eliminates the possibility of a second wave correction within wave v pink and adds a little confidence to the idea of a trend change.
Movement below the parallel channel on the daily chart is required for confidence in a trend change of this size.