
Last analysis expected a little more upwards movement before a small sideways correction to a short term target at 1,509. Price has moved sideways and slightly lower without reaching the target.
The wave count remains the same at the daily chart level, and mostly the same at the hourly chart level. The target has been recalculated.
Click on the charts below to enlarge.
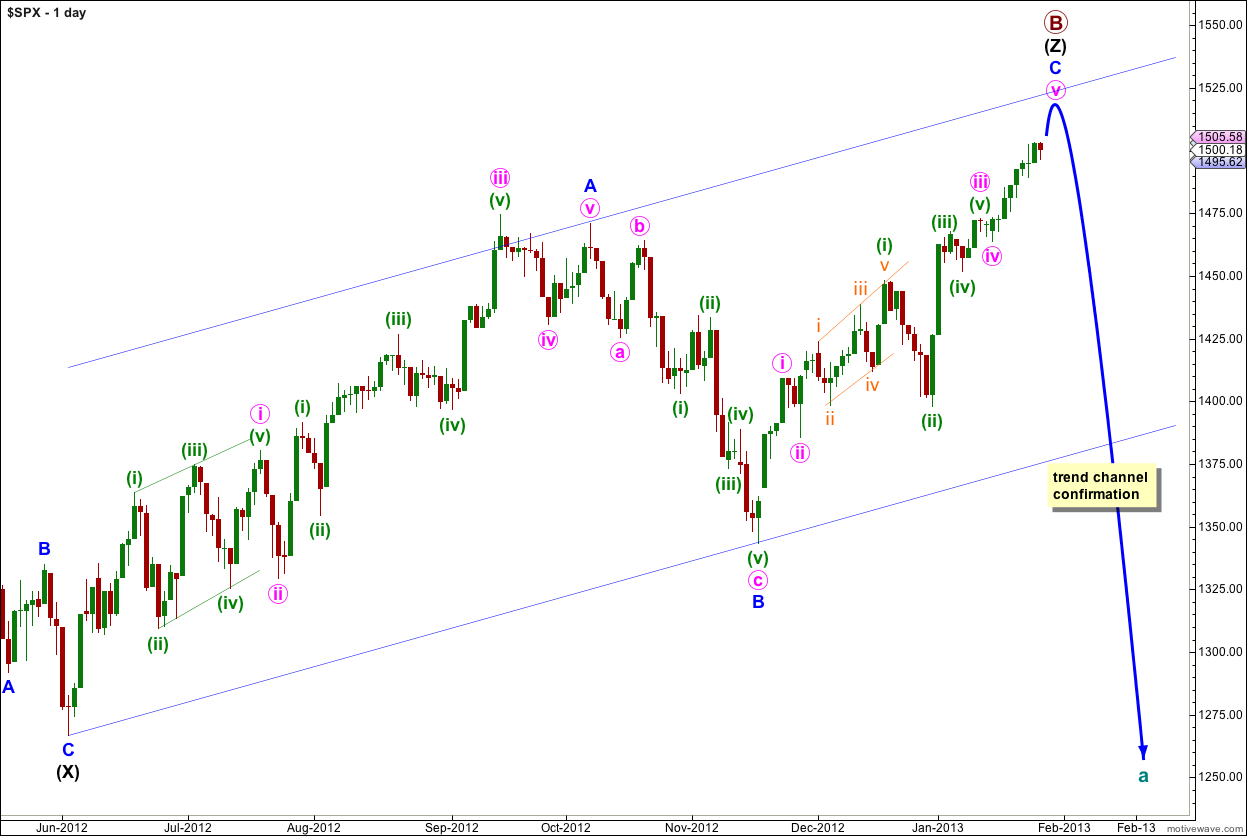
The structure for primary wave B is a triple zigzag, and price is now within the third zigzag in the triple labeled wave (Z) black. Because three is the maximum number of structures within a multiple when this third zigzag is finally complete then the entire correction for primary wave B must be complete. There is no other Elliott wave structure which could allow for upwards movement within this wave count at cycle degree.
Wave (Z) black may now be almost complete as an exaggerated zigzag.
Wave A blue must be truncated to subdivide into a five wave structure.
If primary wave B reaches twice the length of primary wave A at 1,644 although the wave count is not technically invalidated at that point the probability would be so low it should be discarded. At that stage I would switch the monthly wave count to the alternate expanding triangle wave count, which requires a new all time high.
Wave A blue lasted 87 days (2 short of a Fibonacci 89). Wave B blue lasted 28 days. So far wave C blue has lasted 47 days. It may continue for another 8 sessions to last a Fibonacci 55 days.
I have used Elliott’s channeling technique to draw a channel about wave (Z) black zigzag. When this channel is breached by downwards movement we shall have trend channel confirmation of a trend change.
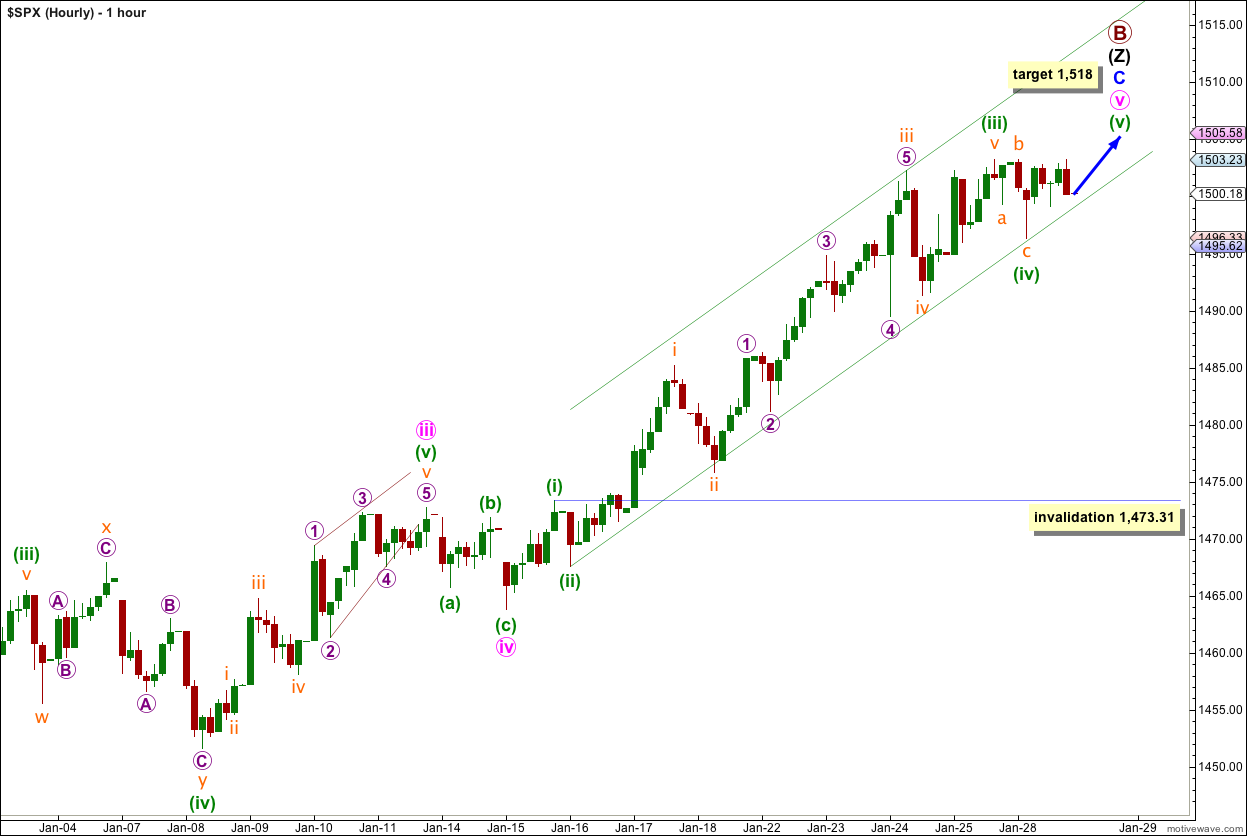
Without price moving higher during Monday’s session it looks like wave (iii) green is over. It has no Fibonacci ratio to wave (i) green.
Ratios within wave (iii) green are: wave iii orange is 1.95 points short of 1.618 the length of wave i orange, and wave v orange 1.08 points longer than 0.618 the length of wave i orange.
At 1,518 wave (v) green would reach 0.618 the length of wave (iii) green. Also at 1,518 wave v pink would reach 0.618 the length of wave iii pink.
The parallel channel drawn about wave (iii) green (on the hourly chart for the last analysis) was breached by downwards movement early in Monday’s session indicating that wave (iii) green was over and wave (iv) green was underway.
I have drawn a channel about wave v pink: the first trend line is drawn from the lows of (ii) to (iv) green, then a parallel copy is placed upon the high of wave iii orange within wave (iii) green. Upwards movement may end mid-way within this channel, or about its upper edge. When this channel is breached by downwards movement then wave v pink may be over. This may be the very first indication of an end to the upwards trend.
There is still divergence with MACD trending lower and price trending higher on the one and two hourly time frames, indicating this trend may be expiring.