
The S&P 500 has moved higher as expected from yesterday’s analysis.
Click on the charts below to enlarge.
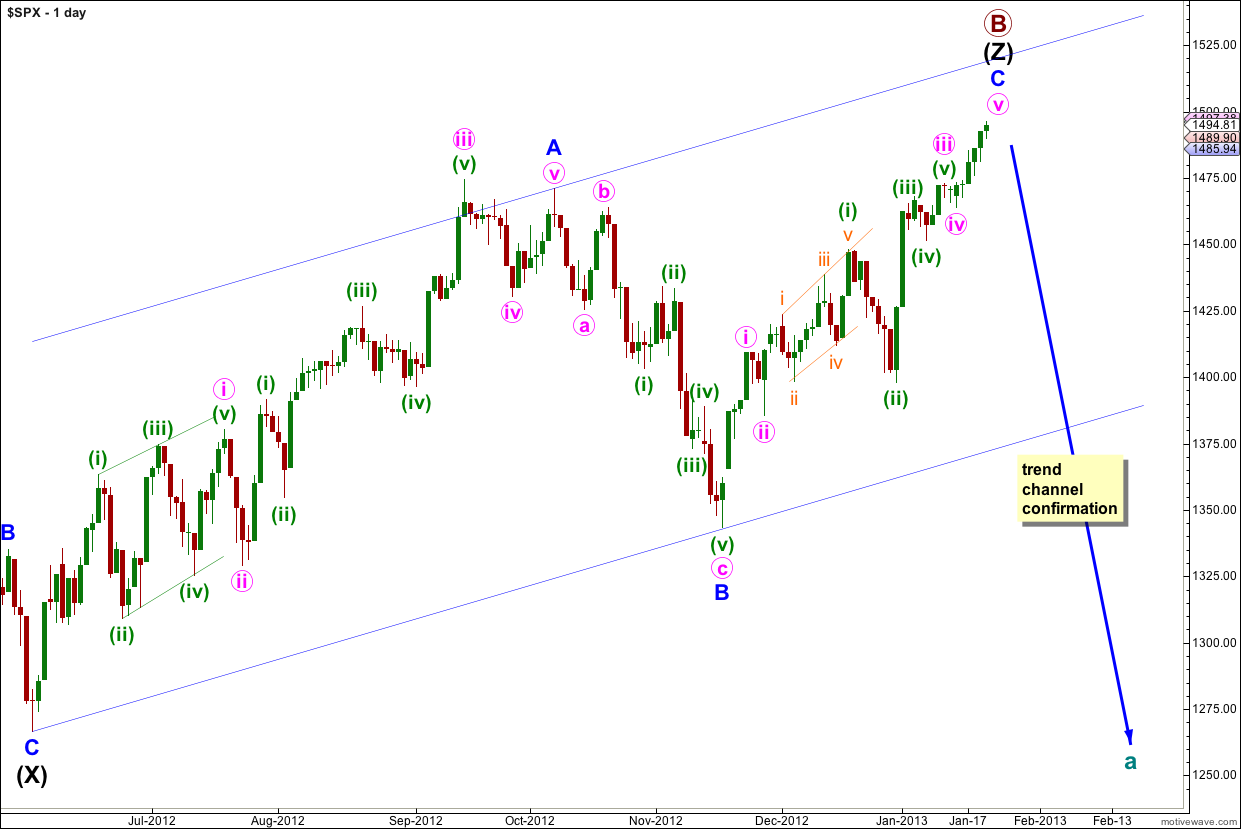
The structure for primary wave B is a triple zigzag, and price is now within the third zigzag in the triple labeled wave (Z) black. Because three is the maximum number of structures within a multiple when this third zigzag is finally complete then the entire correction for primary wave B must be complete. There is no other Elliott wave structure which could allow for upwards movement within this wave count at cycle degree.
Wave (Z) black may now be complete as an exaggerated zigzag.
Wave A blue must be truncated to subdivide into a five wave structure.
Primary wave B is now a 147% correction of primary wave A, not too much longer than the maximum common length of 138%. When primary wave B reaches twice the length of primary wave A although the wave count is not technically invalidated at that point the probability would be so low it should be discarded.
Wave A blue lasted 87 days (2 short of a Fibonacci 89). Wave B blue lasted 28 days. So far wave C blue has lasted 44 days. It may continue for another 11 sessions to last a Fibonacci 55 days.
Final confirmation of a trend change will come with price movement below 1,343.35. At that stage downwards movement may not be a second wave correction within wave C blue and so wave C blue would have to be over.
I have used Elliott’s channeling technique to draw a channel about wave (Z) black zigzag. When this channel is breached by downwards movement we shall have trend channel confirmation of a trend change.
Main Hourly Wave Count.
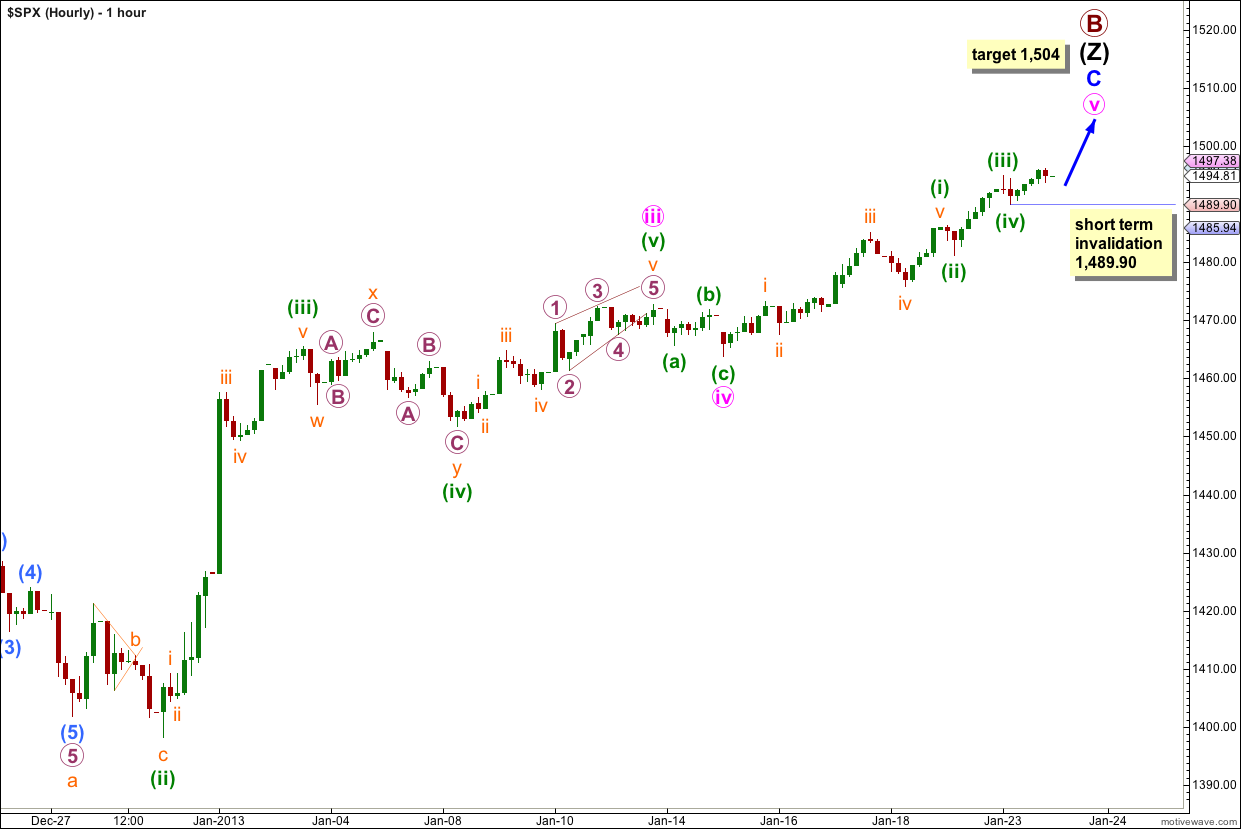
There is continuing divergence on the one and two hour time frames. MACD agrees with this wave count. This trend looks like it is expiring.
Wave (iii) green may have ended during Wednesday’s session. Wave (iii) green is just 0.04 points short of 0.618 the length of wave (i) green. At 1,504 wave (v) green would reach equality with wave (iii) green. Because wave (iii) green is shorter than wave (i) green this is also a maximum limit for wave (v) green.
Also at 1,504 wave v pink would reach 0.618 the length of wave i pink.
This target has a high probability. At 1,504 primary wave B would be a 151% correction of primary wave A.
If price moves above 1,504 then we may expect that wave (iii) green is not over and is extending.
Within wave (v) green wave ii orange may not move beyond the start of wave i orange. This wave count is invalidated with movement below 1,489.9.
Alternate Hourly Wave Count.
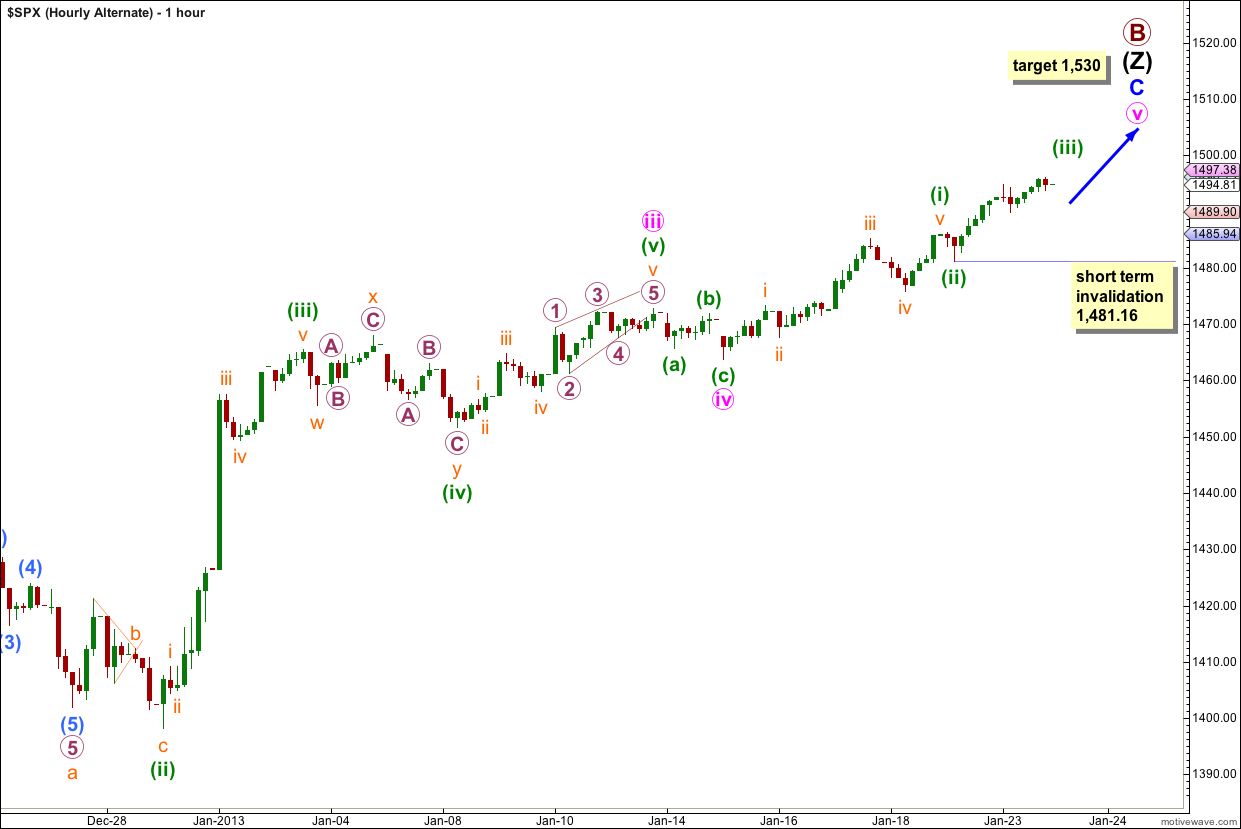
If wave (iii) green is extending then upwards movement may be longer lasting and higher.
At 1,530 wave v pink would reach equality in length with wave i pink.
This alternate wave count has a lower probability because at 1,530 primary wave B would be a 160% correction of primary wave A. This is unlikely (but possible).
Within wave (iii) green wave ii orange may not move beyond the start of wave i orange. This wave count is invalidated with movement below 1,481.16.