
Last week’s analysis expected more upwards movement from the Dow to a target at 13,621. Price has reached 28.93 points above the target and so far the wave count remains valid.
I have a main and a new alternate for you this week. I will also cover the monthly wave count to look at the bigger picture.
Click on the charts below to enlarge.
Monthly Wave Count.
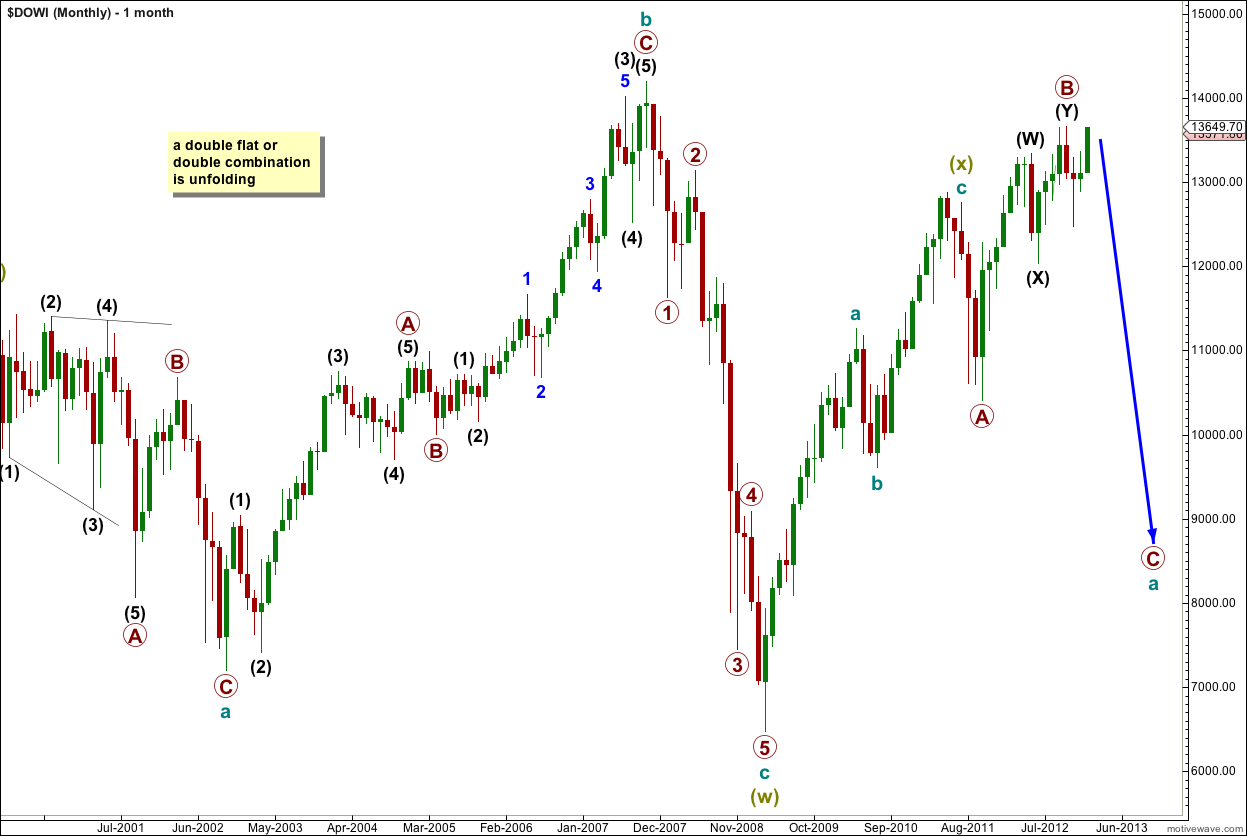
This is the main monthly wave count.
At grand super cycle degree a double flat or double combination may be unfolding.
The first structure in the double is complete as an expanded flat correction labeled super cycle wave (w) (olive green).
The double is joined by a three in the opposite direction labeled super cycle wave (x) which is a zigzag.
Super cycle wave (y) would most likely be a flat correction but may also be a triangle.
Within super cycle wave (y) cycle wave a is incomplete and itself is unfolding as a flat correction. Within it primary wave A subdivides into a three wave structure, a zigzag, and now primary wave B is also complete as a double zigzag.
Primary wave C is extremely likely to make a new low below the end of primary wave A at 10,404.49 to avoid a truncation and a rare running flat.
The main and alternate wave counts below are part of this main monthly wave count. The difference between them is the structure of primary wave B.
Main Daily Wave Count.
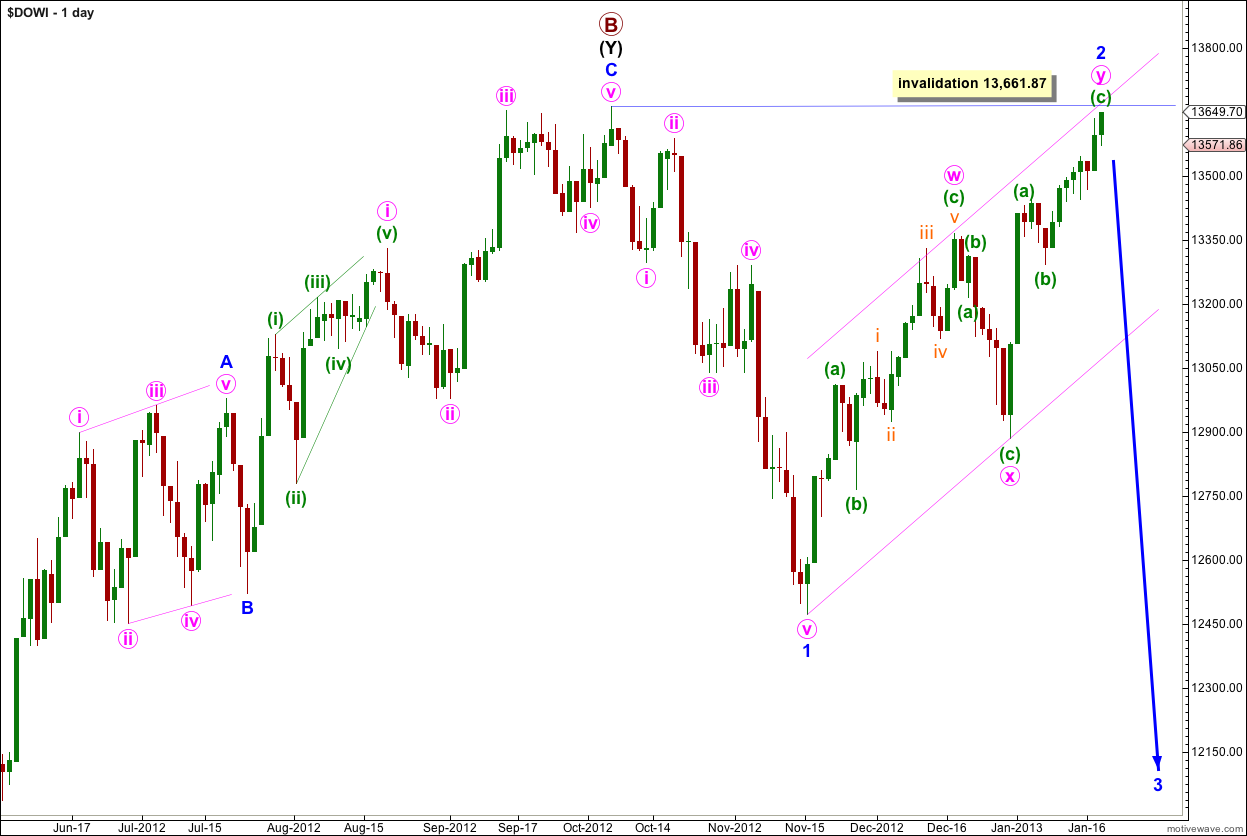
Primary wave B is a 139% correction of primary wave A.
Upwards movement is a double zigzag structure for a complete second wave correction.
Wave 2 blue may not move beyond the start of wave 1 blue. This wave count is invalidated with movement above 13,661.87.
Please keep in mind that we could move the degree of labeling from the high of primary wave B all up one degree. We may have seen intermediate (black) wave (1) complete and this double zigzag may be intermediate wave (2) within primary wave C. We cannot be sure of the degree of labeling until the next third wave is over. Its length and momentum will tell us what degree it is most likely to be.
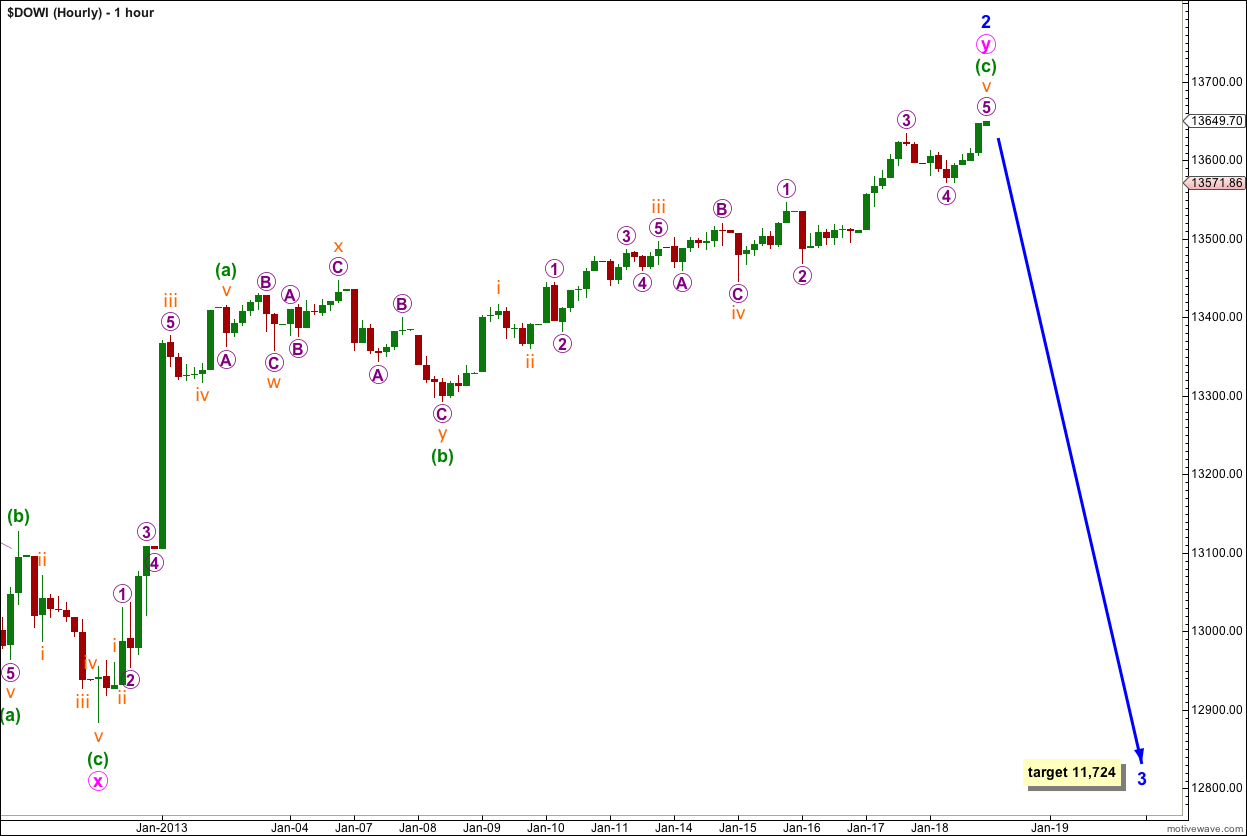
Within the second zigzag structure labeled wave y pink of wave 2 blue the structure is now complete.
Wave (c) green is 28.44 points longer than 0.618 the length of wave (a) green.
Ratios within wave (c) green are: wave iii orange is 13 points longer than equality with wave i orange, and wave v orange is just 4.55 points short of 1.618 the length of wave i orange.
There is not enough downwards movement at the end of Friday’s session to confirm an end to wave v orange. However, there is almost no room left now for upwards movement. If this wave count is correct we must see downwards movement on Monday and for the whole of next week.
Wave 3 blue must move beyond the end of wave 1 blue. This wave count requires movement below 12,471.49.
Movement below the parallel channel on the daily chart would confirm an end to the correction for wave 2 blue.
At 11,724 wave 3 blue would reach 1.618 the length of wave 1 blue. If price continues through this first target then the next target would be at 10,534 where wave 3 blue would reach 2.618 the length of wave 1 blue.
If price moves above 13,661.87 next week then use the alternate daily wave count below.
Alternate Daily Wave Count.
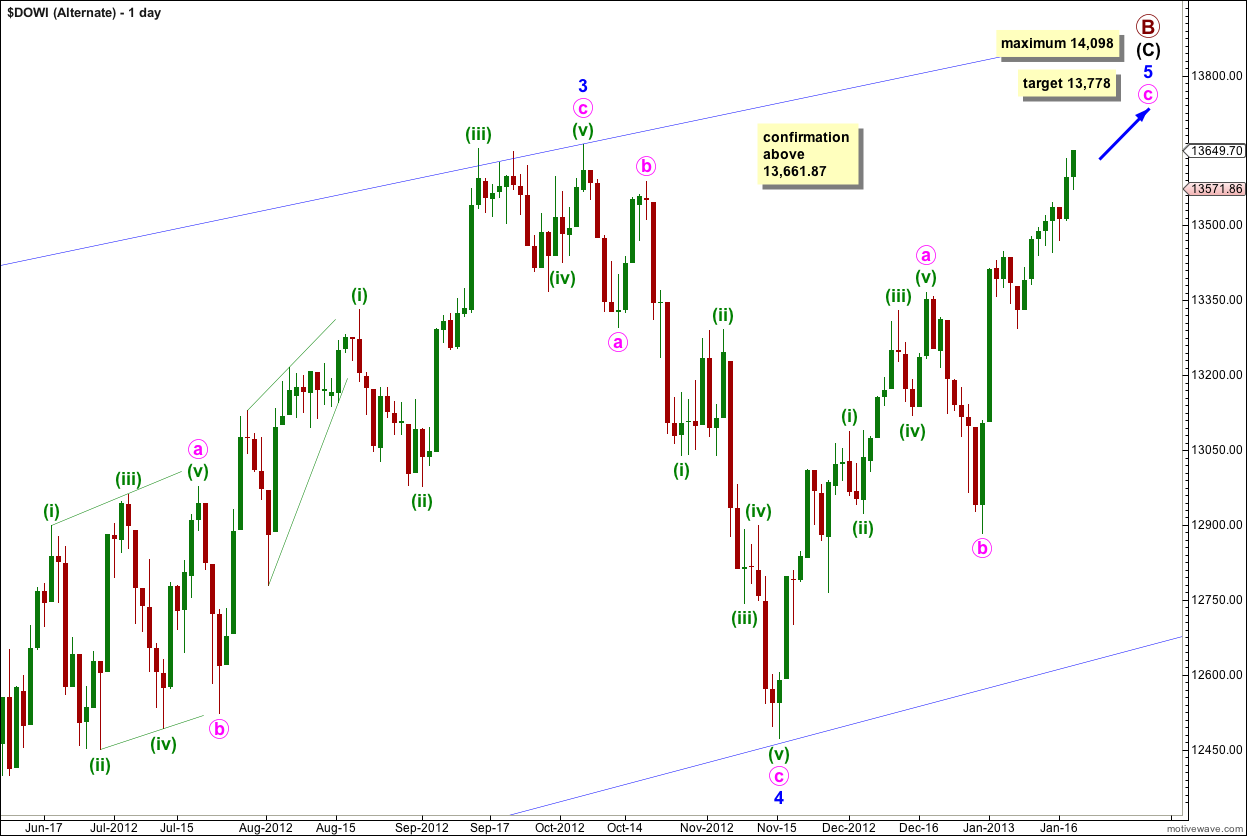
Within primary wave B the structure may be a single zigzag with an ending contracting diagonal for intermediate wave (C).
Within the ending diagonal all the subwaves must subdivide into zigzags. Wave 5 blue of the diagonal must subdivide into a zigzag.
At 13,778 wave c pink within wave 5 blue would reach equality with wave a pink.
Because the diagonal is contracting wave 5 blue should not be longer than wave 3 blue, and it is likely to be significantly shorter. At 14,098 wave 5 blue would reach equality with wave 3 blue and this wave count does not expect movement above this maximum point.