
Last analysis expected upwards movement for the higher probability main hourly wave count which is what happened. However, I had expected upwards movement to increase in momentum which did not happen. Momentum has stayed the same.
The wave count is the same and still has a good look. Today, I have just the one daily and one hourly wave count for you.
Click on the charts below to enlarge.
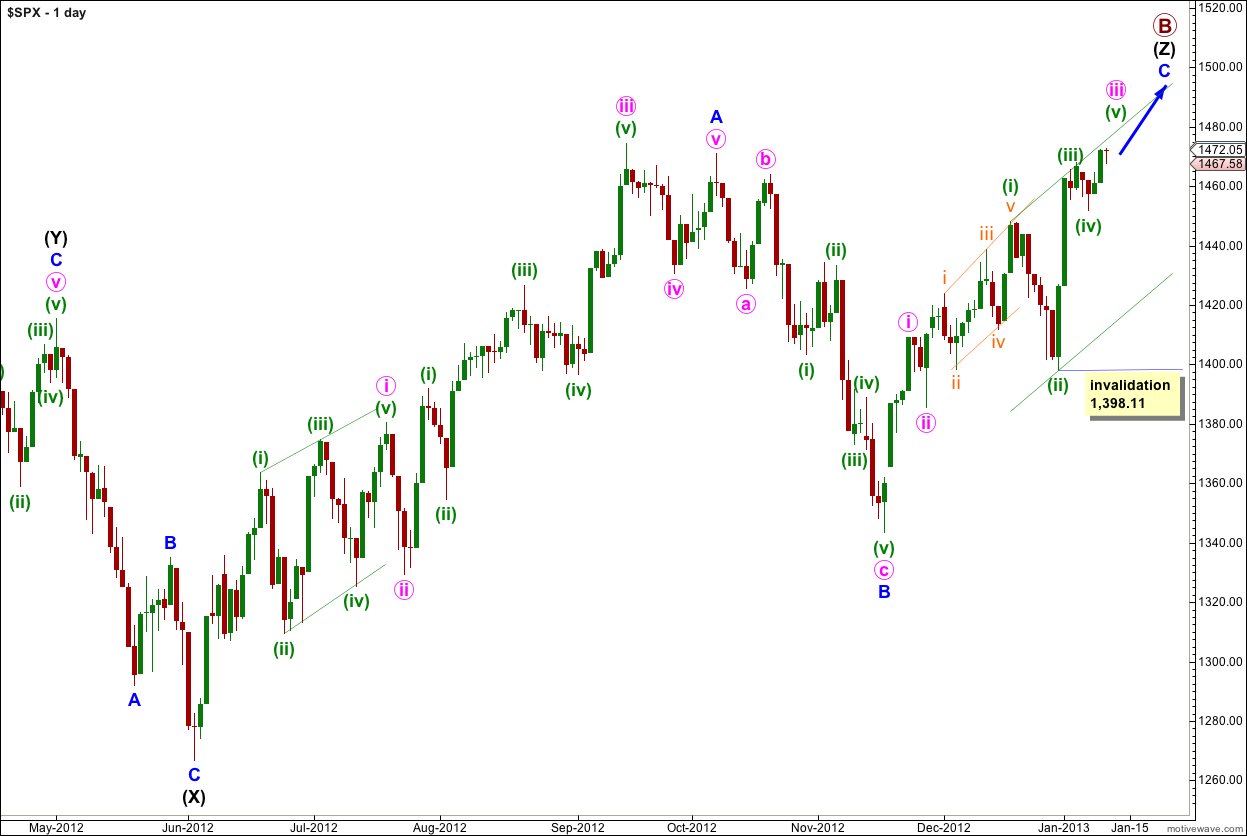
The structure for primary wave B is a triple zigzag, and price is now within the third zigzag in the triple labeled wave (Z) black. Because three is the maximum number of structures within a multiple when this third zigzag is finally complete then the entire correction for primary wave B must be complete. There is no other Elliott wave structure which could allow for upwards movement within this wave count at cycle degree.
Wave (Z) black is incomplete and is unfolding as an exaggerated zigzag.
Wave A blue must be truncated to subdivide into a five wave structure.
At 1,470 wave C blue passed 0.618 the length of wave A blue. Wave C blue has avoided a truncation.
At this time primary wave B has just passed 139% of primary wave A. It is unlikely that price will move too much higher so that primary wave B does not move too far from the common maximum length of 138% the length of primary wave A. When we know the end of waves iii and iv pink within wave C blue then I can use pink wave degree to calculate a target for this upwards movement to end.
There is no upper invalidation point for this wave count, but significant movement above 1,470 has a low probability.
Wave A blue lasted 87 days (2 short of a Fibonacci 89). Wave B blue lasted 28 days. So far wave C blue has lasted 37 days and at this stage I am expecting it to possibly continue for another two weeks, or thereabouts.
Wave C blue is unfolding as an impulse. The structure is incomplete and requires further upwards movement.
Last analysis had two hourly wave counts. At this stage the alternate expanding triangle now does not have the right look. Because of this, and because expanding triangles are extremely rare Elliott wave structures, I will not publish the alternate again even though it may technically be valid. Its probability is too low.
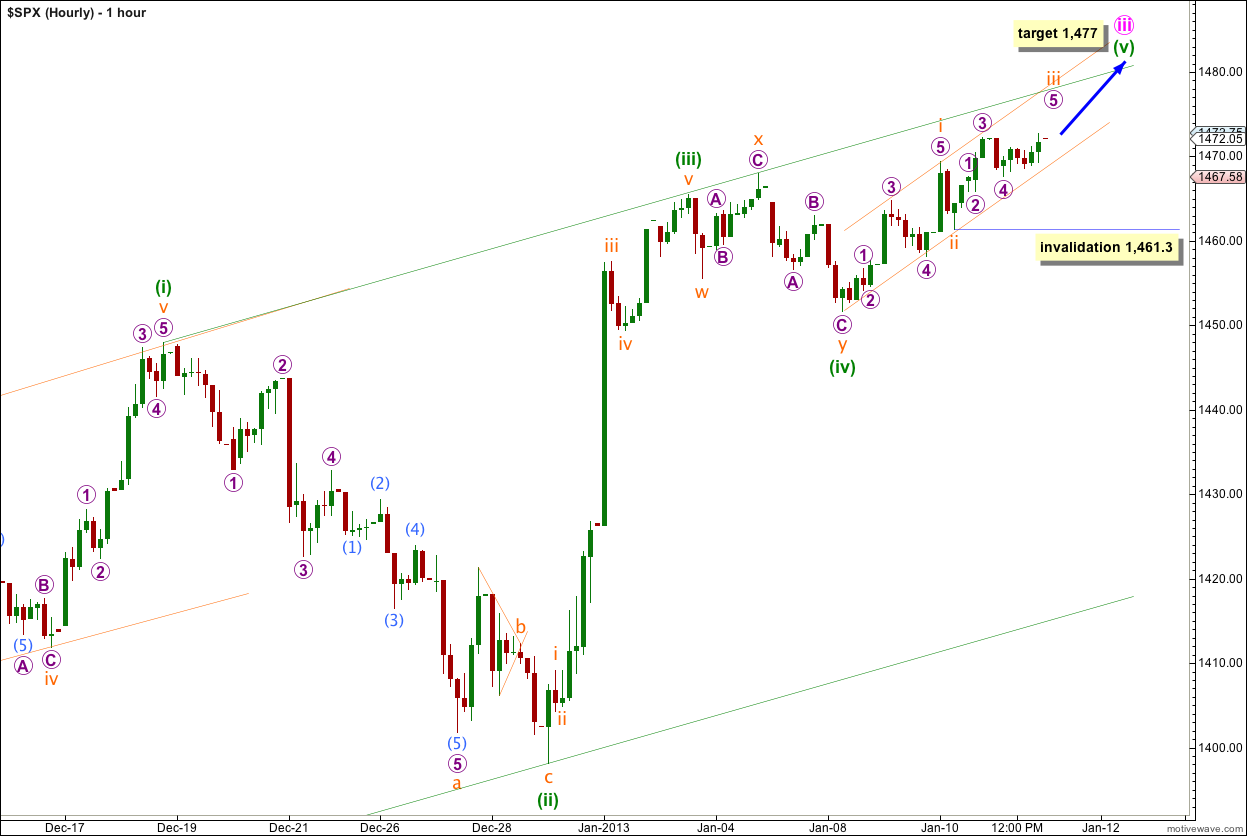
Within wave (v) green to complete wave iii pink the structure is still incomplete. We may have seen the middle of wave iii orange complete during Friday’s session. Or, if we move the labeling within wave iii orange down one degree, we may only have seen wave 1 purple within wave iii orange almost complete. Either way this structure requires more upwards movement.
At 1,477 wave (v) green would reach 0.382 the length of wave (iii) green. If price continues higher through this first target then the next target would be calculated at 1,490 where wave (v) green would reach 0.618 the length of wave (i) green. However, there is already an adequate Fibonacci ratio (equality) between waves (i) and (iii) green so we may not see a Fibonacci ratio between wave (v) green and either of (i) or (iii). At this stage the best guide to where upwards movement may find resistance is the upper edge of the parallel channel.
Draw the channel using Elliott’s first technique with a trend line first from the highs of waves (i) to (iii) green, then a parallel copy upon the low of wave (ii) green.
I have also drawn a best fit channel about wave (v) green. The point at which this smaller orange channel intersects with the wider green channel may be where wave iii orange ends and where upwards movement may find some resistance.
Within wave iii orange no second wave correction may move beyond the start of its first wave. This wave count is invalidated with movement below 1,461.30.