
Last analysis expected some downwards movement from the S&P 500 for Monday’s session, within a limited range. Price has moved lower. It has not yet reached the short term target.
The daily wave count is the same. At this stage I have two hourly wave counts for you which look at the unfolding structure as one of two possibilities. They both expect much the same movement next, but the ranges differ.
Click on the charts below to enlarge.
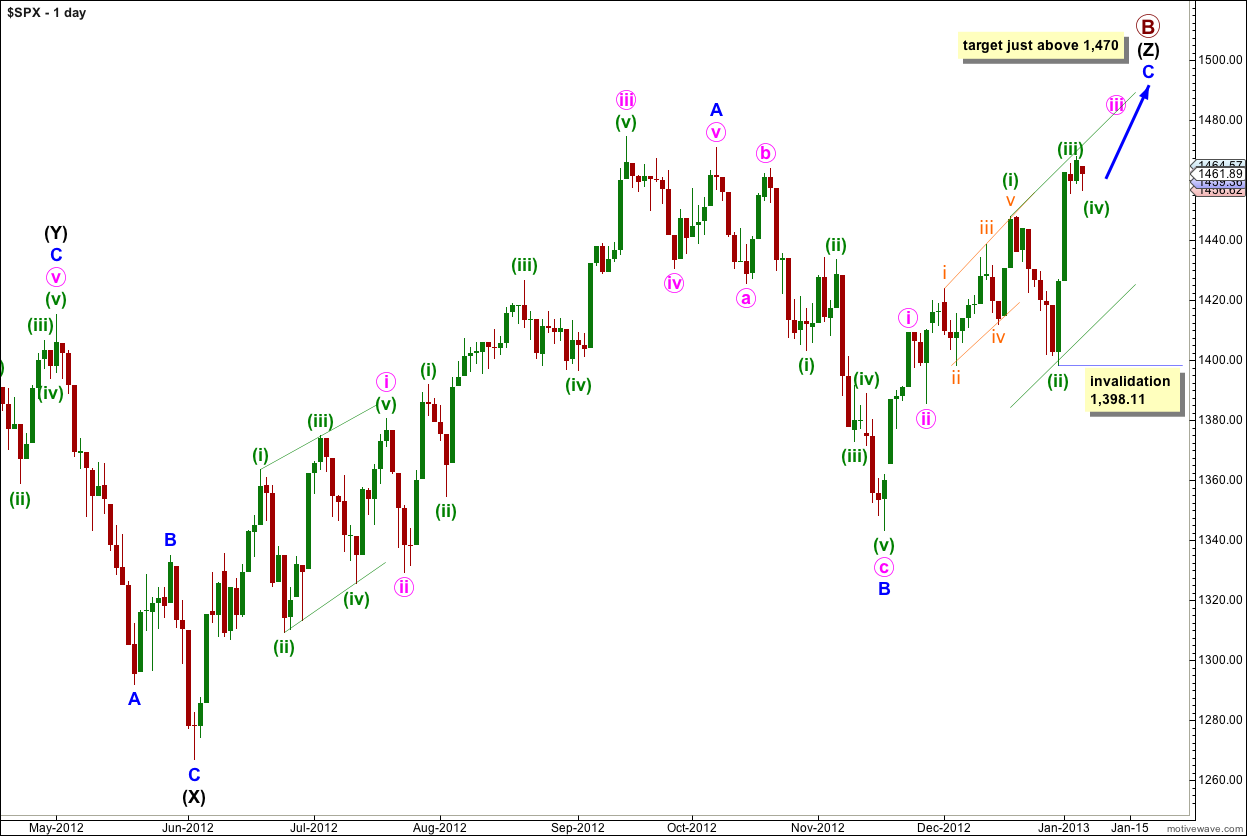
The structure for primary wave B is a triple zigzag, and price is now within the third zigzag in the triple labeled wave (Z) black.
Wave (Z) black is incomplete and is unfolding as an exaggerated zigzag.
Wave A blue must be truncated to subdivide into a five wave structure.
At 1,470 wave C blue would reach 0.618 the length of wave A blue. About this point primary wave B would also be only 139% of primary wave A. Movement to slightly above 1,470 would avoid a truncation and keep the length of primary wave B closer to the common maximum of 138%.
There is no upper invalidation point for this wave count, but significant movement above 1,470 has a low probability.
Wave A blue lasted 87 days (2 short of a Fibonacci 89). Wave B blue lasted 28 days. I would expect wave C blue to be about 34 days in duration. So far it has lasted 33 days and at this stage I am expecting it to possibly continue for another two to three weeks.
Wave C blue must subdivide into a five wave structure as either an ending diagonal or an impulse. An ending diagonal requires all subwaves to subdivide as zigzags and because the first wave upwards labeled i pink is a five wave impulse an ending diagonal may be eliminated. Wave C blue must be unfolding as an impulse. The structure is incomplete and requires further upwards movement.
Wave Four Triangle.
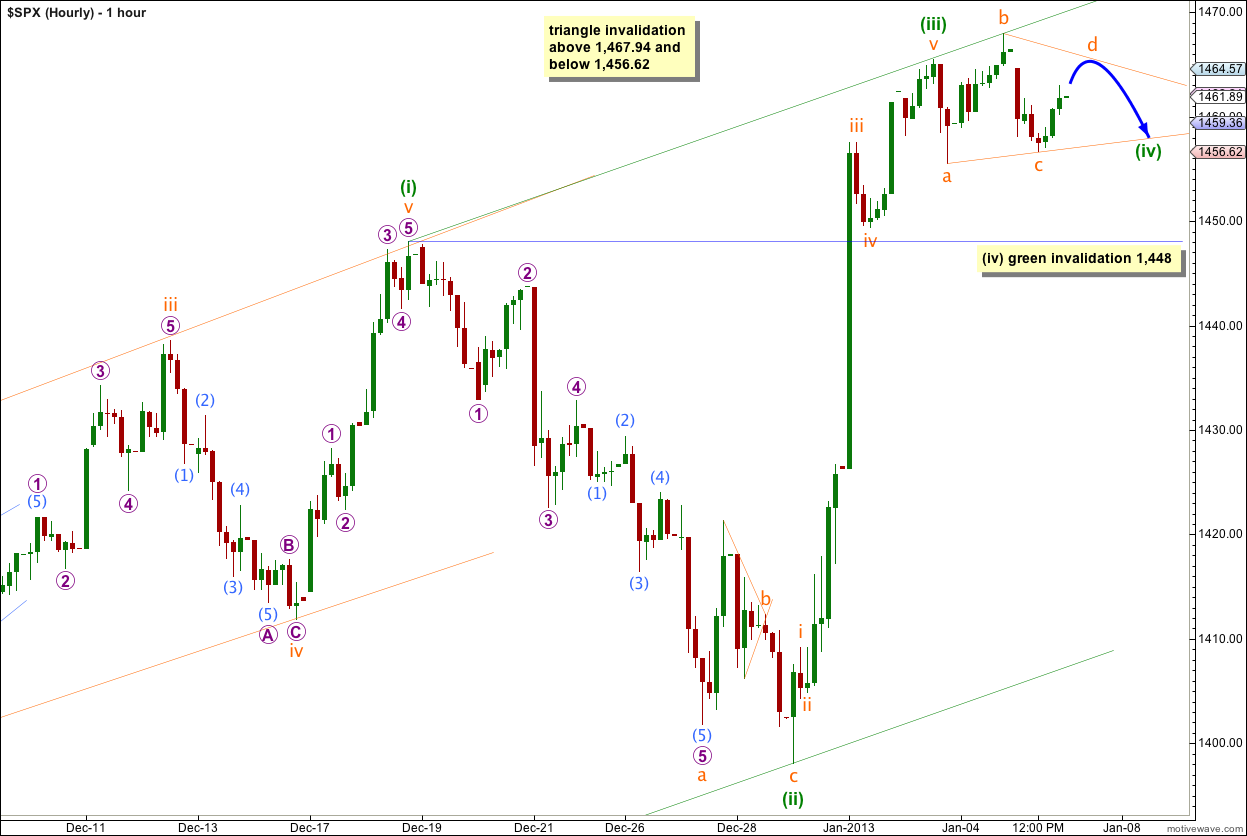
Wave (iv) green has several structural options: a triangle (this wave count above), a flat correction (the wave count below), a double or combination or a zigzag. At this stage we can eliminate a zigzag only. When the first structure is complete then we will have to consider multiples.
Because price did not move below the low labeled wave a orange within (iv) green at 1,455.53 wave (iv) green may be unfolding as a running contracting triangle.
If price continues to move sideways in a narrowing range for another one to three sessions then the triangle will increase in probability.
For the triangle to remain valid price cannot move much above 1,467.94 and may not move below 1,456.62.
If this is a barrier triangle then wave d orange may end about the same level of wave b orange. In practicality this means wave d orange may end very slightly above wave b orange, and as long as the b-d trend line is essentially flat the structure would be valid.
For both a barrier and contracting triangle wave e may not move beyond the end of wave c orange. Wave e orange should end either with an overshoot (more likely) or and undershoot (less likely) of the a-c trend line.
When the triangle is complete we should expect a sharp upwards thrust out of it.
If price moves below 1,456.62 or above 1,467.94 in the next one or two sessions then we may use the next wave count below.
Wave Four Flat Correction.
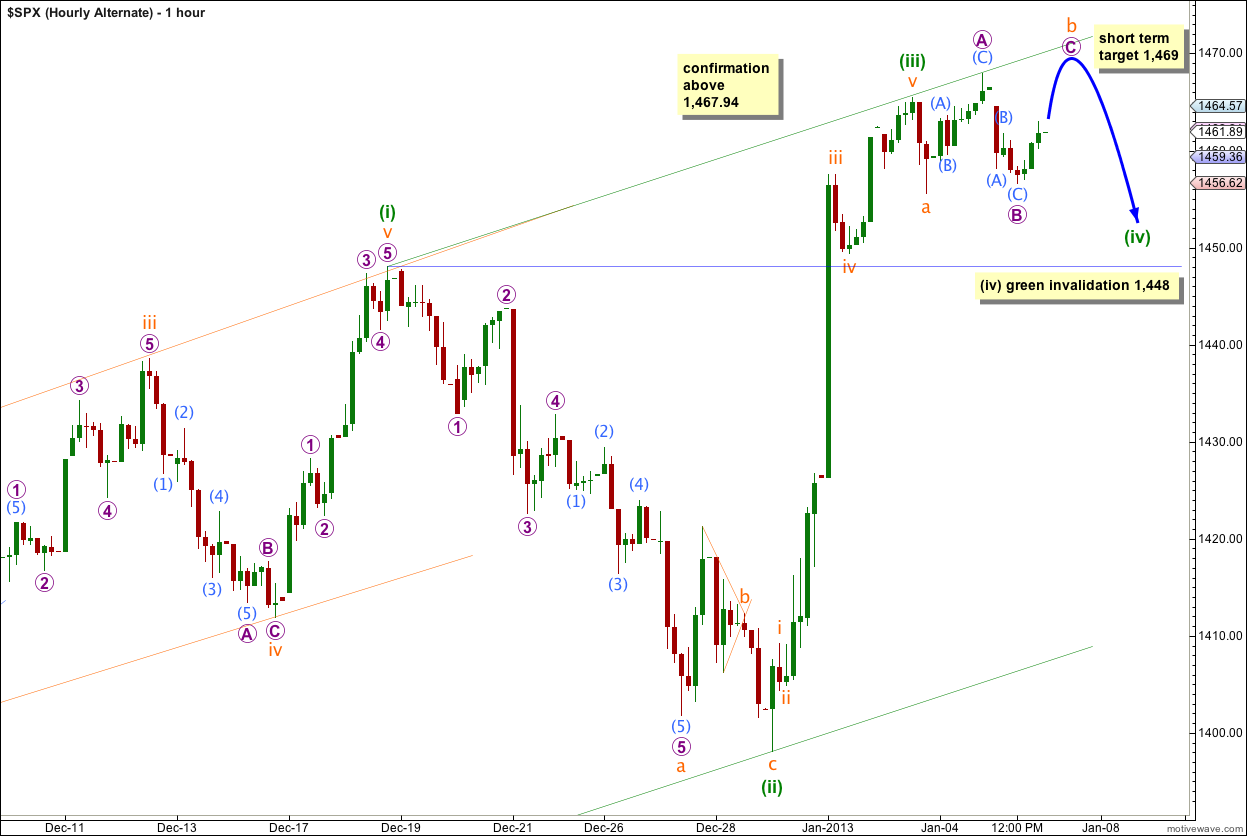
Wave (iv) green may be unfolding as a flat correction with an exaggerated wave b orange in the middle of it.
If wave b orange is unfolding itself as a flat it would be a regular flat; wave B purple is a 91% correction of wave A purple and both subdivide into threes. Wave C purple would most likely reach equality with wave A purple in length at 1,469.
Thereafter, wave c orange would be extremely likely to make a new low below the end of wave a orange at 1,455.53 to avoid a truncation.
Wave (iv) green may not move into wave (i) green price territory. This wave count is invalidated with movement below 1,448.