
Last analysis expected Wednesday’s session to begin with upwards movement but not as much as was seen. Price breached the short term invalidation point on the main hourly wave count and has invalidated the alternate.
I have just the one main wave count for you today.
Click on the charts below to enlarge.
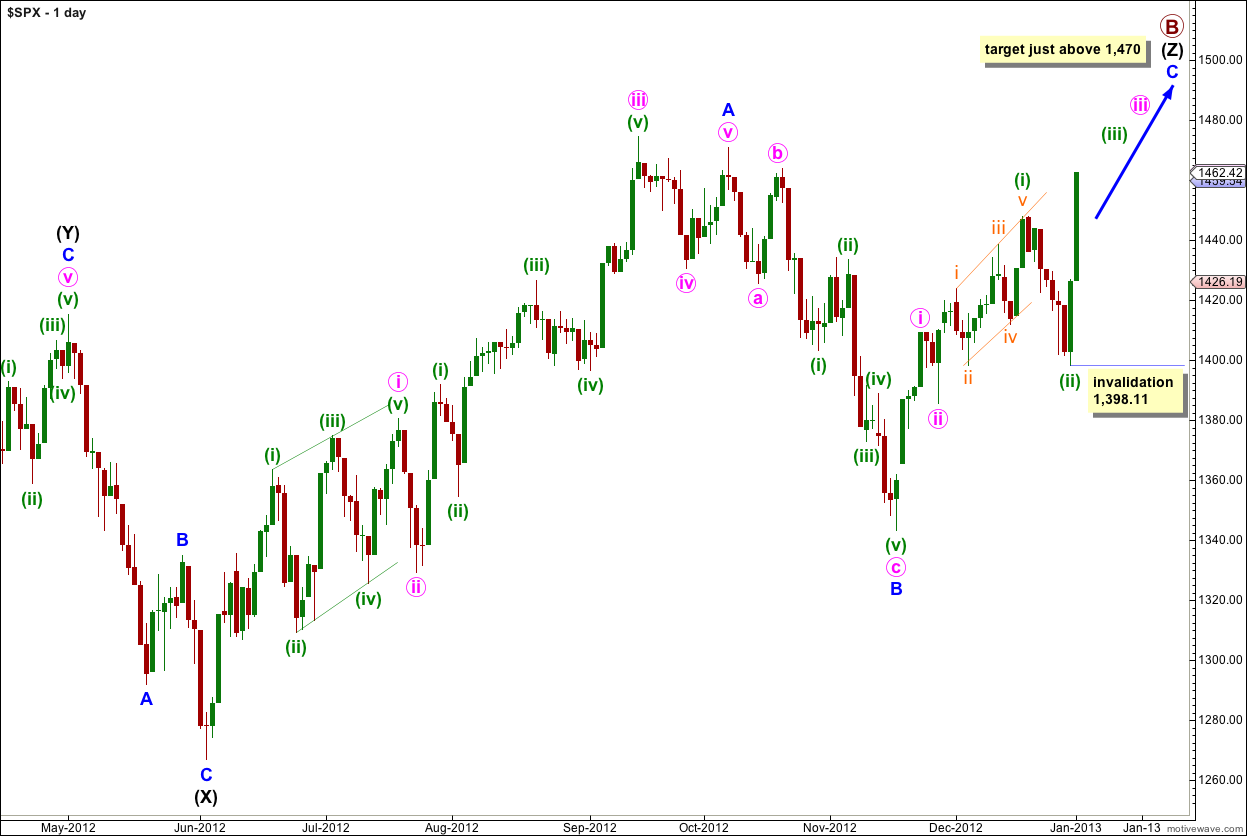
The structure for primary wave B is a triple zigzag, and price is now within the third zigzag in the triple labeled wave (Z) black.
Wave (Z) black is incomplete and is unfolding as an exaggerated zigzag.
Wave A blue must be truncated to subdivide into a five wave structure.
At 1,470 wave C blue would reach 0.618 the length of wave A blue. About this point primary wave B would also be only 139% of primary wave A. Movement to slightly above 1,470 would avoid a truncation and keep the length of primary wave B closer to the common maximum of 138%.
There is no upper invalidation point for this wave count, but significant movement above 1,470 has a low probability.
Wave A blue lasted 87 days (2 short of a Fibonacci 89). Wave B blue lasted 28 days. I would expect wave C blue to be about 34 days in duration. So far it has lasted 30 days and at this stage I am expecting it to possibly continue for another two to three weeks.
Wave C blue must subdivide into a five wave structure as either an ending diagonal or an impulse. An ending diagonal requires all subwaves to subdivide as zigzags and because the first wave upwards labeled i pink is a five wave impulse an ending diagonal may be eliminated. Wave C blue must be unfolding as an impulse. The structure is incomplete and requires further upwards movement.
Recent upwards movement from the low labeled wave B blue at 1,343.35 looks like a smaller fractal of the upwards movement from the low labeled wave (X) black.
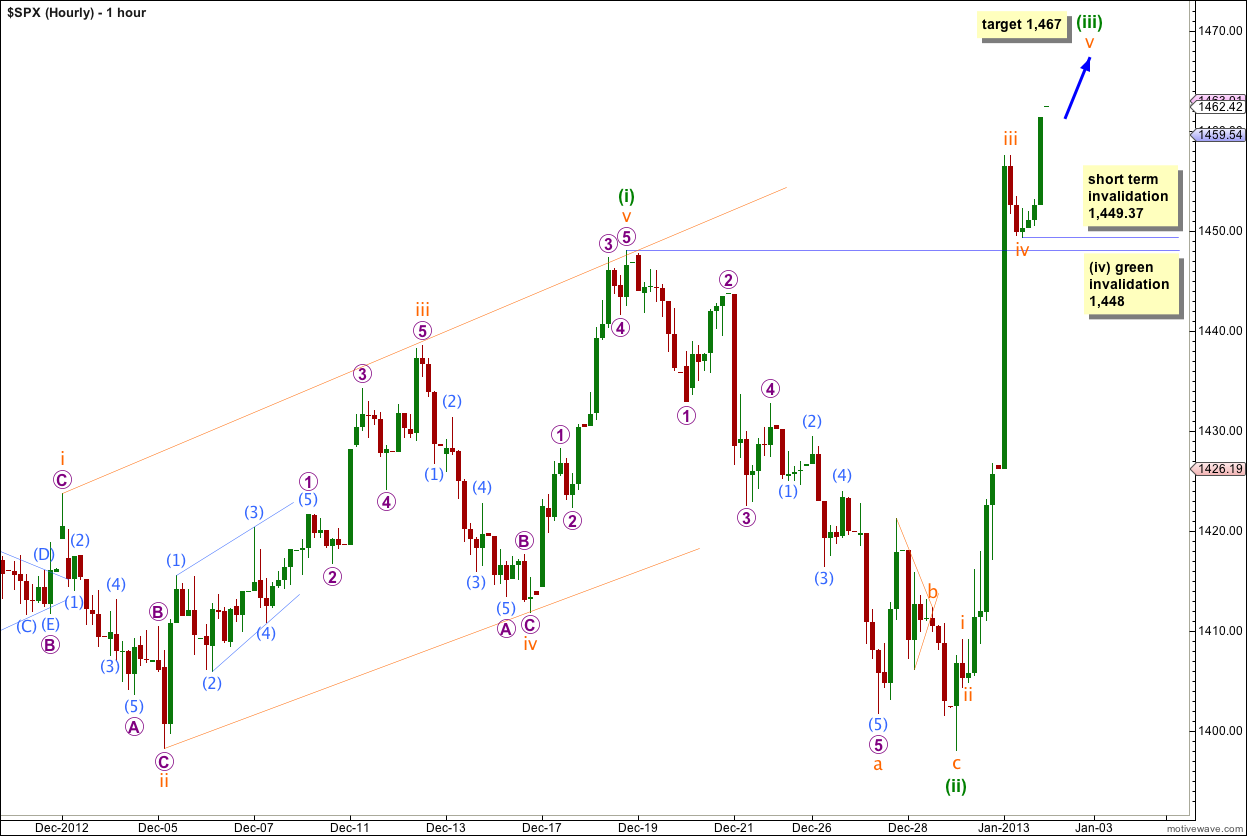
Wave b orange within wave (ii) green was a completed triangle structure. Movement to a new high beyond the start of wave (ii) green has confirmed that wave (ii) green was over and wave (iii) green is underway.
Wave (ii) green was a deep correction which lasted a Fibonacci 8 days.
At 1,467 wave v orange within wave (iii) green would reach 1.618 the length of wave i orange. Because there is no adequate Fibonacci ratio between waves i and iii orange it is more likely we shall see a ratio exhibited between wave v orange and either of i or iii orange.
On the five minute chart the structure of wave v orange looks incomplete. It looks like it has just completed the third wave within it and so we should expect a little more upwards movement when markets open tomorrow.
When wave v orange completes wave (iii) green we should expect a longer lasting correction for wave (iv) green which may not move back into wave (i) green price territory. At that stage the invalidation point will be at 1,448.
When markets open tomorrow the invalidation point will be at 1,449.37. Within wave v orange no second wave correction may move beyond the start of its first wave.
Wave (ii) green was a deep zigzag. Given the guideline of alternation we would expect wave (iv) green to be a shallow sideways moving flat, triangle or combination correction. It should last about a week.