
Last analysis expected some upwards movement before price turned lower, but this is not what happened. Price has just moved lower.
The main wave count remains valid and little changed. I have an hourly chart for the alternate for you to end the week.
Click on the charts below to enlarge.
Main Wave Count.
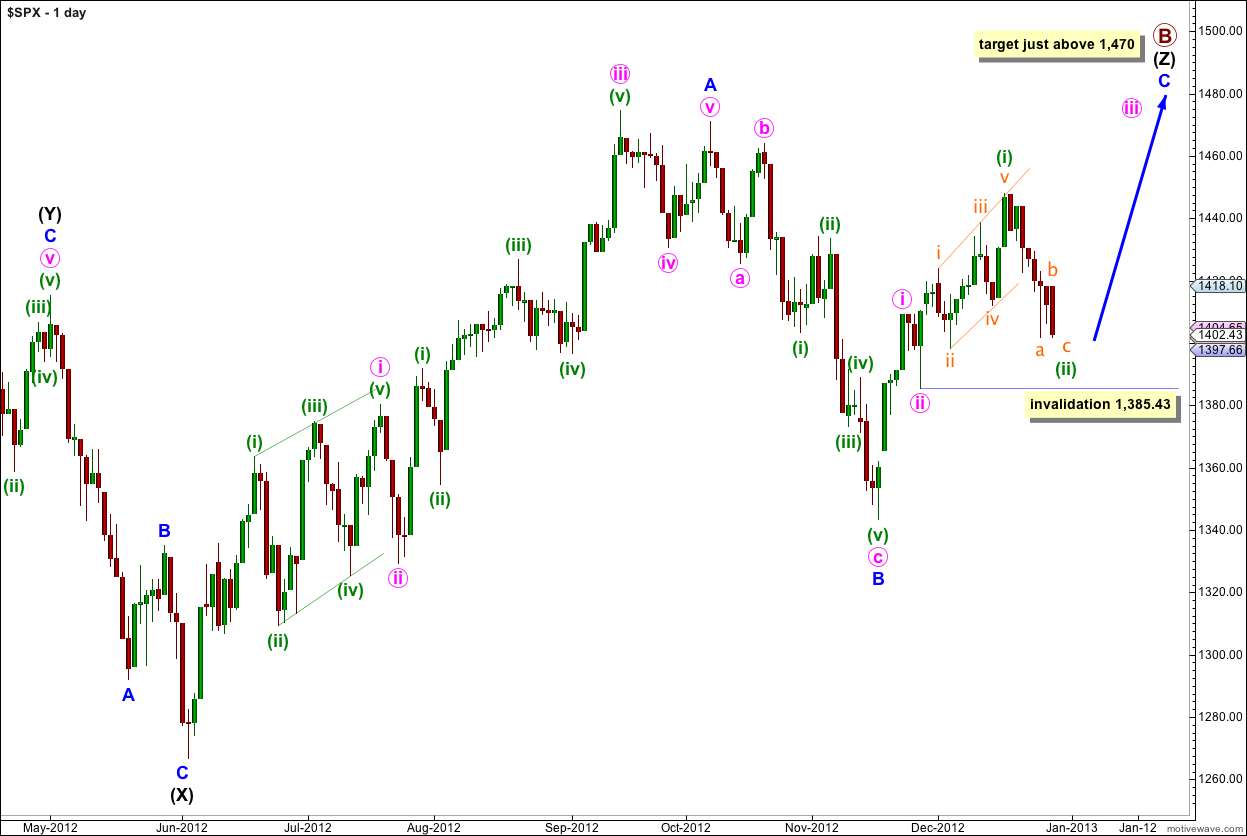
The structure for primary wave B is a triple zigzag, and price is now within the third zigzag in the triple labeled wave (Z) black.
Wave (Z) black is incomplete and is unfolding as an exaggerated zigzag.
Wave A blue must be truncated to subdivide into a five wave structure.
At 1,470 wave C blue would reach 0.618 the length of wave A blue. About this point primary wave B would also be only 139% of primary wave A. Movement to slightly above 1,470 would avoid a truncation and keep the length of primary wave B closer to the common maximum of 138%.
There is no upper invalidation point for this wave count, but significant movement above 1,470 has a low probability.
Wave A blue lasted 87 days (2 short of a Fibonacci 89). Wave B blue lasted 28 days. I would expect wave C blue to be about 34 days in duration. So far it has lasted 29 days and it should continue for another one to two weeks.
Wave C blue must subdivide into a five wave structure as either an ending diagonal or an impulse. An ending diagonal requires all subwaves to subdivide as zigzags and because the first wave upwards labeled i pink is a five wave impulse an ending diagonal may be eliminated. Wave C blue must be unfolding as an impulse. The structure is incomplete and requires further upwards movement.
Recent upwards movement from the low labeled wave B blue at 1,343.35 looks like a smaller fractal of the upwards movement from the low labeled wave (X) black.
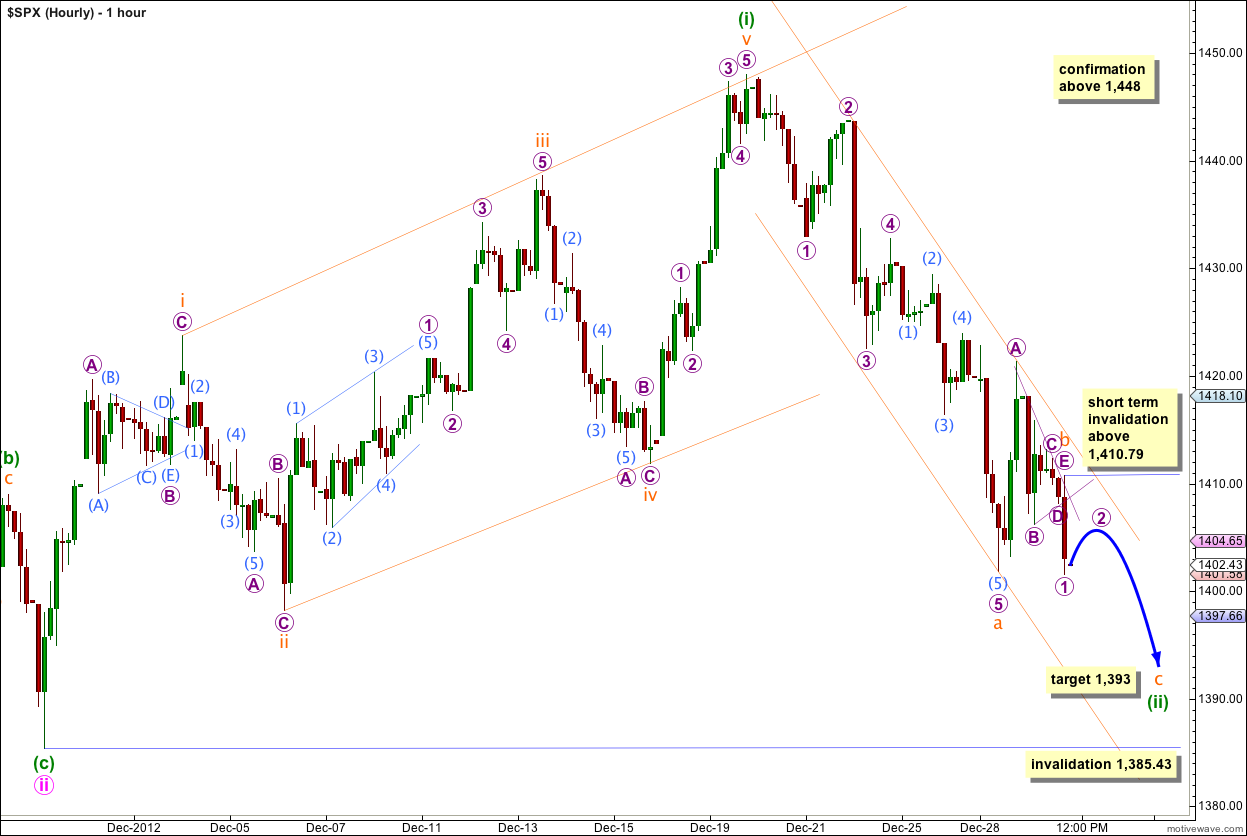
Last analysis expected wave b orange to move higher. This is not what happened, but wave b orange did move further as a sideways triangle.
Within the triangle wave C purple is itself a triangle. This structure has a good look on the five minute chart.
Following completion of the triangle downwards movement subdivides into a five wave impulse. Because it has not made a new low below the end of wave a orange at 1,401.8 it is likely that downwards movement is just wave 1 purple within wave c orange. Wave c orange is likely to end below the end of wave a orange to avoid a truncation.
At 1,393 wave c orange would reach 0.382 the length of wave a orange.
Within wave c orange wave 2 purple may not move beyond the start of wave 1 purple. In the short term this wave count is invalidated with movement above 1,410.79. If price moves above that point in the next one or two sessions then it is possible that wave c orange is complete and truncated and that wave (ii) green is complete. At that stage I would expect upwards movement may be wave (iii) green which must make a new high.
The channel drawn here is a best fit. When it is clearly breached by upwards movement we may expect that wave (ii) green is complete and wave (iii) green has begun.
Wave c orange to complete wave (ii) green may not move beyond the start of wave (i) green. This wave count is invalidated with movement below 1,385.43.
If this wave count is invalidated with downwards movement then we may use the alternate below.
Alternate Wave Count.
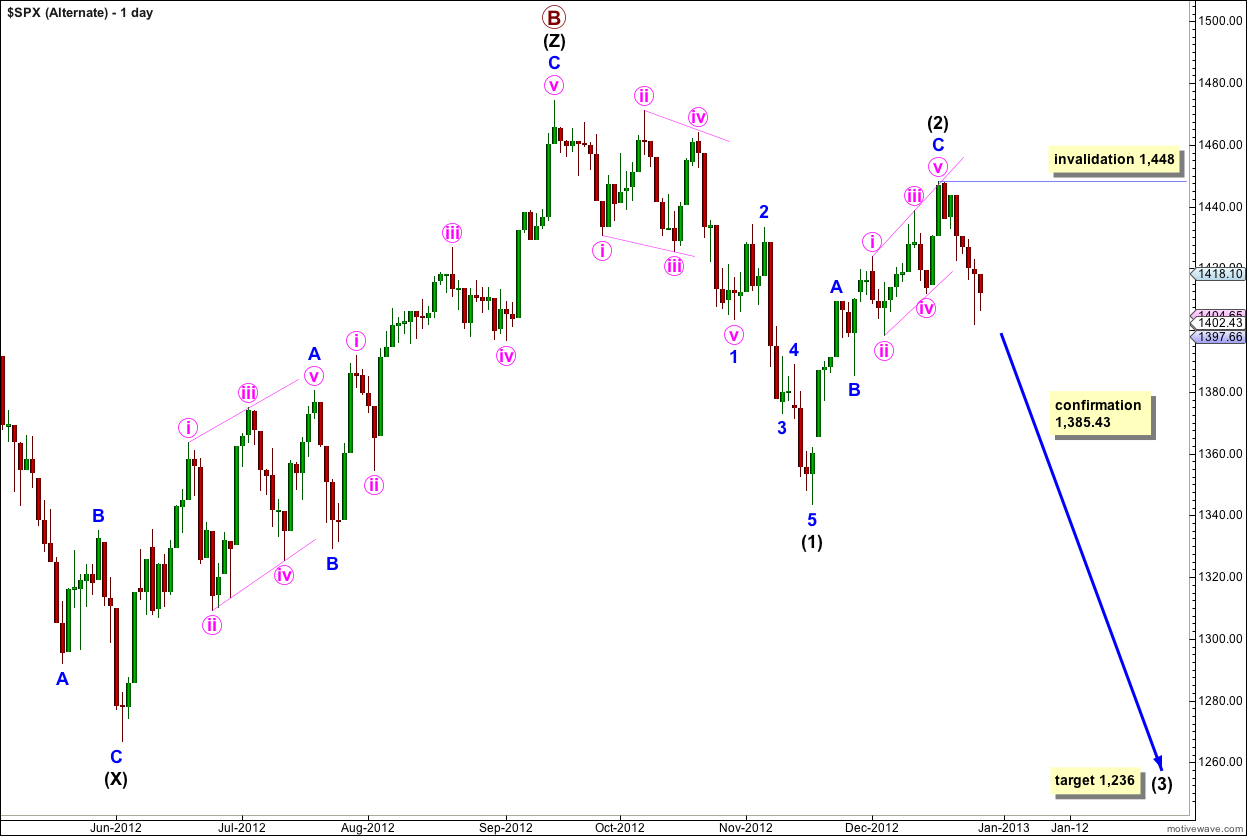
While price is below 1,474.51 it is still possible that primary wave B is a complete triple zigzag and downwards movement is the start of primary wave C.
Downwards movement from the high is difficult to see as an impulse and it cannot be a leading diagonal. The problem is the first series of overlapping waves labeled wave 1 blue. I have labeled this as a leading diagonal and each subwave subdivides correctly, but the wave lengths are not as expected. The structure is neither an expanding or contracting diagonal, wave iv pink is shorter than wave ii pink, but wave iii pink is longer than wave i pink and wave v pink is longer than wave iii pink.
This reduces the probability that this wave count is correct, but it does suffer from the same problem now as the main wave count (although to a greater degree).
The biggest problem with this wave count is the subdivisions of wave C blue within wave (2) black. All the subwaves of an ending diagonal must subdivide into zigzags, and within this structure subwaves iii and v pink look very much like five wave impulses on the hourly chart. This reduces the probability of this wave count significantly.
Upwards movement from the low of wave (1) black subdivides nicely into a zigzag and so may be a completed second wave correction for wave (2) black which is an 80% correction of wave (1) black. Wave C blue is just 3.24 points short of equality with wave A blue.
If this alternate is correct then we may expect movement below 1,385.43 to confirm it within the next two weeks.
Wave (3) black will reach 1.618 the length of wave (1) black at 1,236.
Within wave (3) black no second wave correction may move beyond the start of its first wave. This wave count is invalidated with movement above 1,448.
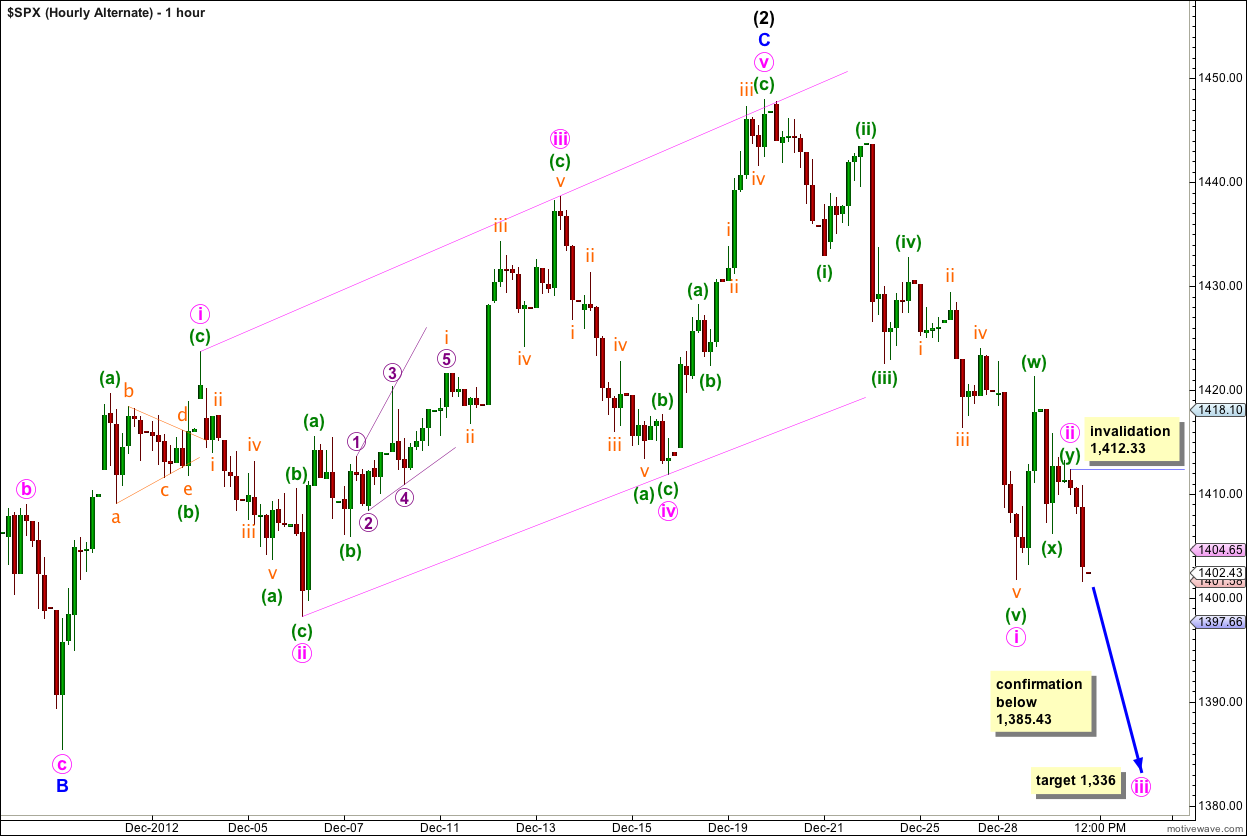
If upwards movement to the high at 1,448 is a complete zigzag for wave (2) black then wave C blue within it must be an ending diagonal. Within an ending diagonal all the subwaves must subdivide into zigzags. Waves iii and v pink are subjective; it is possible to see these movements as both zigzags and impulses. This wave count sees them as zigzags. I have checked subdivisions carefully on the five minute chart and it has a nice fit. With that done I now consider this alternate wave count to have a very good probability.
Downwards movement following the end of wave (2) black subdivides nicely into a five wave impulse with an extended fifth wave.
Wave ii pink may have been a double combination: wave (w) green is a zigzag, wave (x) green joining the two structures in the double is a zigzag, and wave (y) green is a triangle ending at 1,412.33.
At 1,336 wave iii pink would reach 1.618 the length of wave i pink.
Movement below 1,385.43 would invalidate the main wave count and confirm this alternate. At that stage we may have more confidence in this alternate and expect the target to be met.
Within wave iii pink no second wave correction may move beyond the start of its first wave. This wave count is invalidated with movement above 1,412.33.
If price moves above 1,412.33 it is possible that wave ii pink is not over and is continuing further as a more complicated and time consuming correction. As it is labeled here it is remarkably brief and shallow for a second wave, so movement above the invalidation point on this hourly chart would indicate a continuation of the second wave and would not invalidate the trend change.