Last analysis expected upwards movement during Friday’s session but price has moved lower. Downwards movement has not moved below the invalidation point on the hourly chart and the wave count remains valid and still has the right look.
I still have the same one daily and one hourly wave count for you.
Click on the charts below to enlarge.
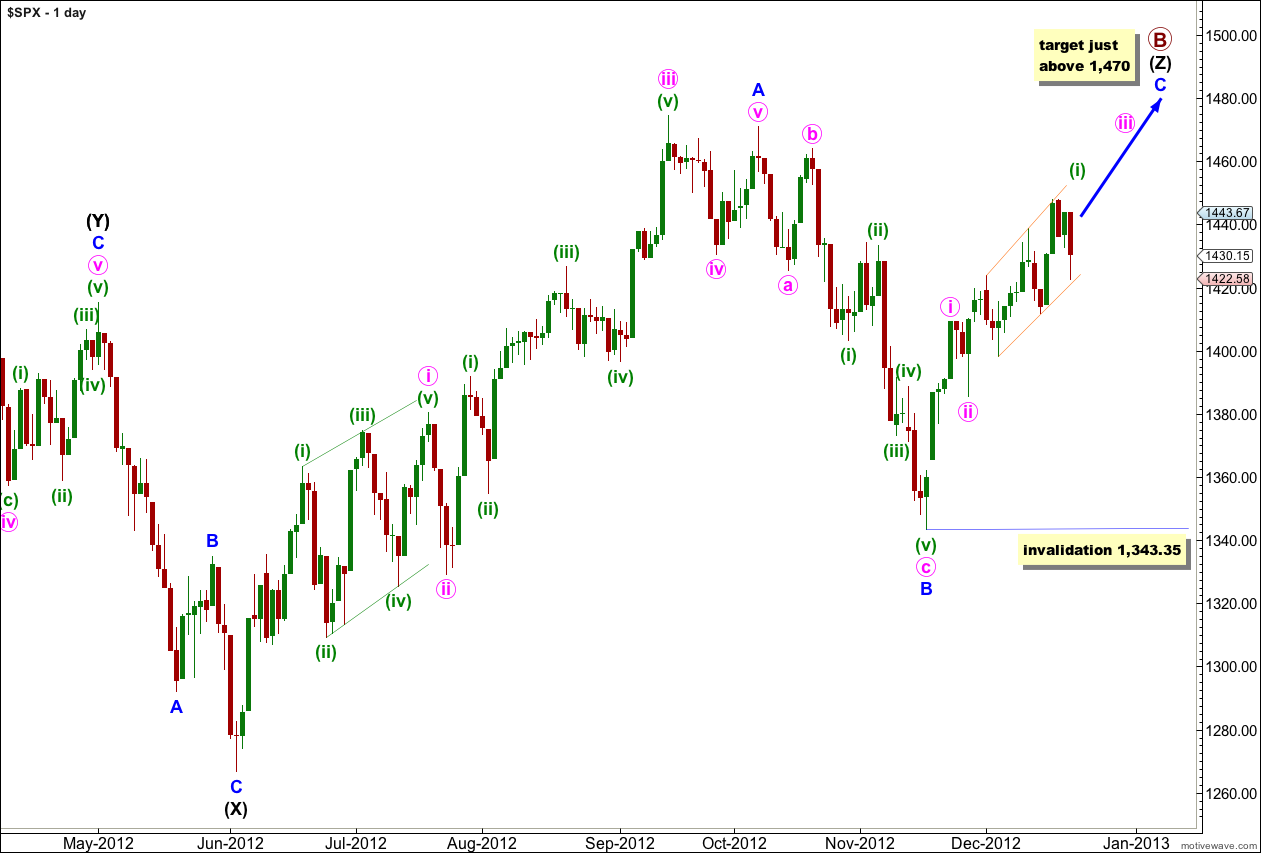
The structure for primary wave B is a triple zigzag, and price is now within the third zigzag in the triple labeled wave (Z) black.
Wave (Z) black is incomplete and is unfolding as an exaggerated zigzag.
Wave A blue must be truncated to subdivide into a five wave structure.
At 1,470 wave C blue would reach 0.618 the length of wave A blue. About this point primary wave B would also be only 139% of primary wave A. Movement to slightly above 1,470 would avoid a truncation and keep the length of primary wave B closer to the common maximum of 138%.
There is no upper invalidation point for this wave count, but significant movement above 1,470 has a low probability.
Wave A blue lasted 87 days (2 short of a Fibonacci 89). Wave B blue lasted 28 days. I would expect wave C blue to be about 34 days in duration. So far it has only lasted 24 days and it should continue for another couple one to three weeks.
Wave C blue must subdivide into a five wave structure as either an ending diagonal or an impulse. An ending diagonal requires all subwaves to subdivide as zigzags and because the first wave upwards labeled i pink is a five wave impulse an ending diagonal may be eliminated. Wave C blue must be unfolding as an impulse. The structure is incomplete and requires further upwards movement.
Recent upwards movement from the low labeled wave B blue at 1,343.35 looks like a smaller fractal of the upwards movement from the low labeled wave (X) black.
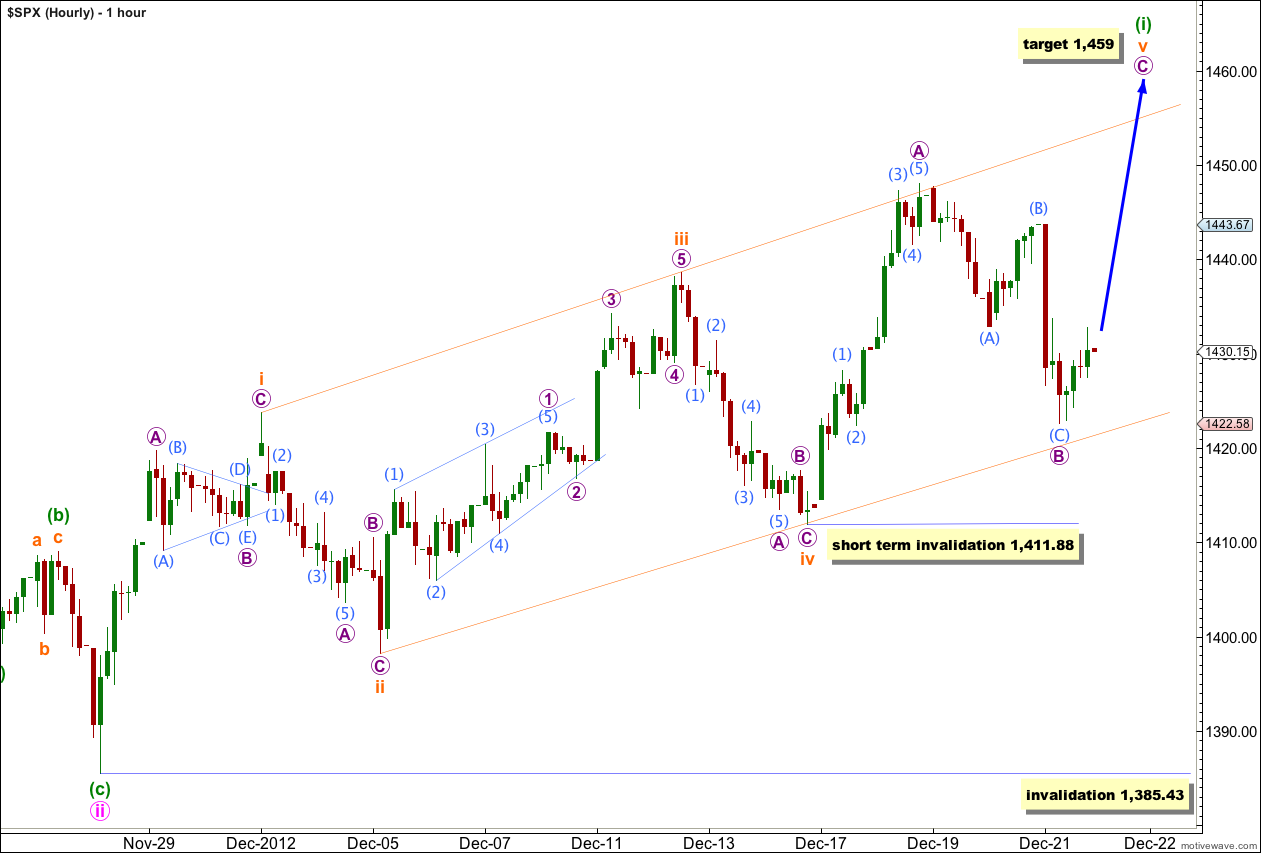
Downwards movement has made wave B purple an exaggerated zigzag lasting 20 hours. Wave A purple lasted 16 hours so these two movements are still in proportion to each other.
Downwards movement may have found support at the lower trend line of the diagonal.
The diagonal is expanding and wave v orange should be longer than wave iii orange. At 1,452 wave v orange would reach equality with wave iii orange so we should expect upwards movement to reach above this point.
At 1,459 wave C purple within the zigzag of wave v orange would reach equality with wave A purple. This upwards movement may last two sessions.
I have seen structures which in hindsight can only be diagonals, and which do not always conform to expected wave lengths in that some times the third wave is the longest. If price moves below 1,411.88 then I would expect that wave (i) green would be over and the fifth wave was longer than the first, but not the third. As long as the third wave is never the shortest (a core rule for any and all EW structures which must be met) the other wave lengths of a diagonal are sometimes not what is expected. (Diagonals are the only EW structure for which I would ever make any slight exception to any rule or guideline. For all other structures, the rules must always be fully met).
Within wave v orange, if wave B purple is not over and continues further sideways or lower as a double combination it may not move beyond the start of wave A purple. This wave count is invalidated with movement below 1,411.88 in the short term.
When wave (i) green leading diagonal is complete we may expect the following second wave correction to be very deep, probably over 0.618 of wave (i) green.
Wave (ii) green may not move beyond the start of wave (i) green. This wave count is invalidated with movement below 1,385.43.


Futures .. nice ride down today trading under SM(50) 1406 now
To soon to be over … the daily trend is currently positive over 1411.88
Every major top I’ve seen in the last 30 years has occurred in stages. First, monthly patterns end and obey all the rules. You think that’s it, but then weekly structure must go through its final steps. Daily charts experience the same time-delaying process. Each lower degree creates a “window of opportunity” for the downtrend to begin.
“I’ve looked at charts and will alter the hourly wave count to see wave (i)
green leading diagonal as complete,and downwards movement of the last three
sessions wave (ii) green. I would expect more downwards movement now for
about another week.” Lara
About another week?? That would be great, but I just do not see it. This is why….
It looks like we have 5 waves down now from 1448 and with the NYMO under the lower BB line the next wave could be back over 1448.00 http://scharts.co/ZBsKSh
IF the NYMO closes back inside the lower BB line it would be a buy alert.
Your Wave iii orange took about 8 days http://www.timeanddate.com/date/durationresult.html?m1=12&d1=5&y1=2012&m2=12&d2=12&y2=2012&ti=on
And now Wave v orange could take 16 days does that really look right to you??
Agreed. I think it’s over, the entire diagonal is over.