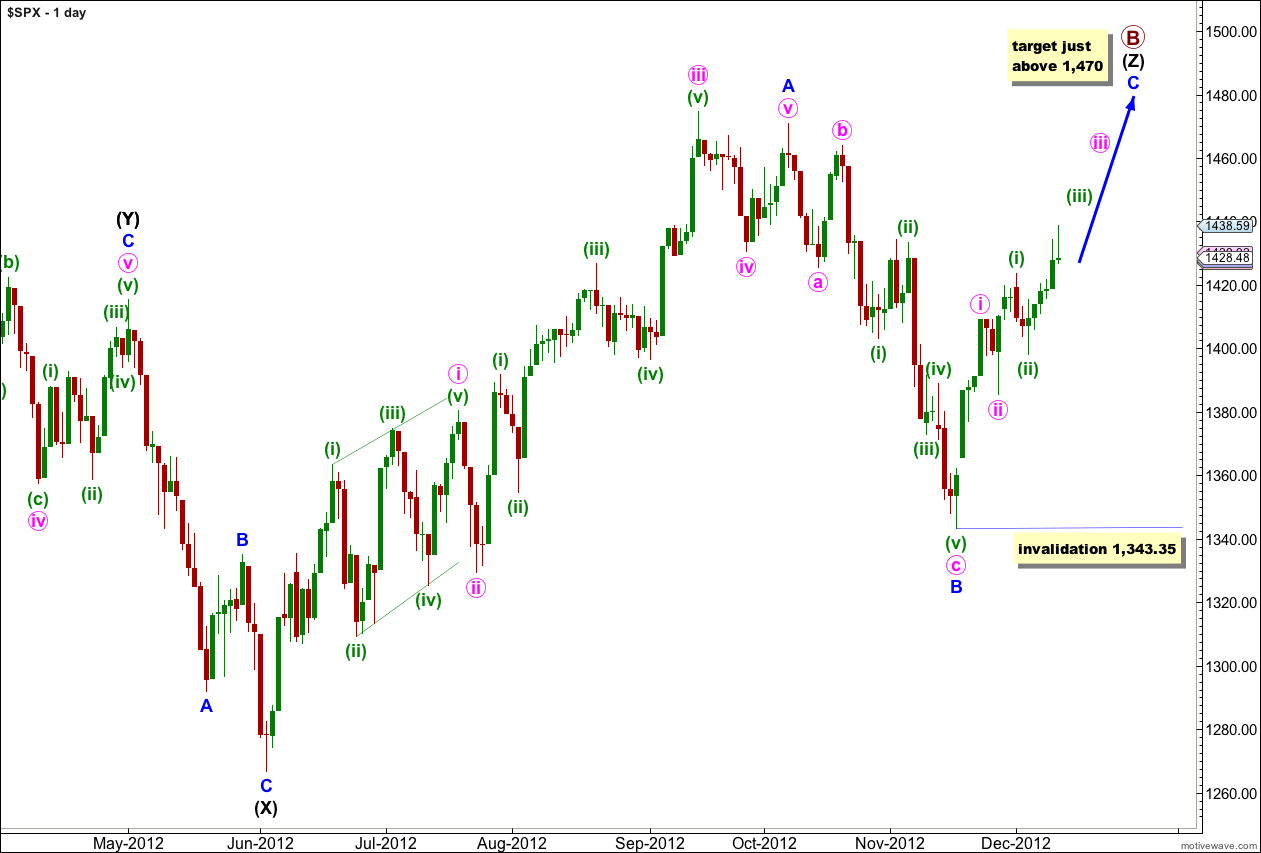
Movement up to 1,434.27 has not invalidated the wave count but it does indicate that the alternate is correct. The Dow has invalidated its main wave count and confirmed its alternate and I would expect the S&P 500 to follow.
There is now just one wave count today.
Click on the charts below to enlarge.
This wave count will be confirmed with movement above 1,434.27.
The structure for primary wave B is the same and this wave count is the same at the monthly chart level up to the start of wave (Z) black, the third zigzag in the triple.
Wave (Z) black may be incomplete and may be unfolding as a more exaggerated zigzag.
Wave A blue must be truncated to subdivide into a five wave structure.
At 1,470 wave C blue would reach 0.618 the length of wave A blue. About this point primary wave B would also be only 139% of primary wave A. Movement to slightly above 1,470 would avoid a truncation and keep the length of primary wave B closer to the common maximum.
There is no upper invalidation point for this wave count, but significant movement above 1,470 has a low probability.
Wave A blue lasted 87 days (2 short of a Fibonacci 89). Wave B blue lasted 28 days. I would expect wave C blue to be about 34 days in duration. So far it has only lasted 16 days and it should continue for another month or so.
The structure of wave C blue is incomplete. What is there so far cannot be subdivided into either an ending diagonal or an impulse, the only two possible structures for a C wave.
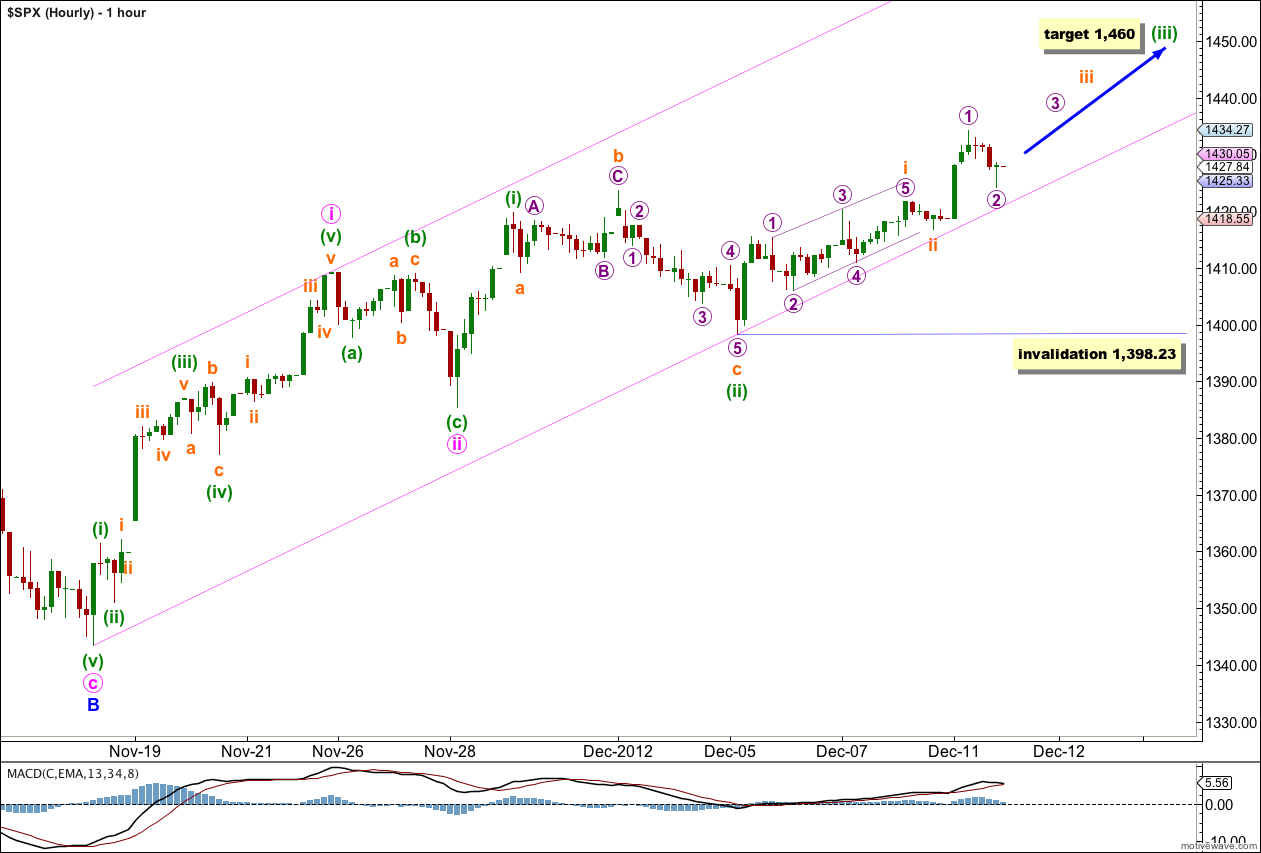
The third wave within wave C blue is unlikely to be over. MACD should show an increase in momentum when the middle of the third wave upwards unfolds.
At 1,460 wave (iii) green would reach 1.618 the length of wave (i) green.
Within wave (iii) green wave i orange looks most like a leading contracting diagonal. However, following a leading diagonal in a first wave position the second wave correction is normally very deep. This one is very shallow. It may not be over. If it does move lower it may not move beyond the start of wave i orange. This wave count is invalidated with movement below 1,398.23.
The parallel channel drawn here is a best fit. I would expect the third wave to reach the upper edge of the channel and possibly overshoot it.


Why would you not see 1434.27 as a double top?
Because the Dow requires more upwards movement, and so the S&P 500 will probably follow. Otherwise they’ll diverge quite significantly. I just don’t see that happening.
Although, I could be completely wrong with this wave count. I’m always looking for alternate ideas, and if I find one I’ll publish it.