Last analysis expected price to break out of the narrow range it has been trading in for the last four sessions, but it did not do this. Price moved slightly higher remaining below the invalidation point on the hourly chart, still.
The wave count is the same.
I have a new daily alternate to consider. It has a low probability.
Click on the charts below to enlarge.
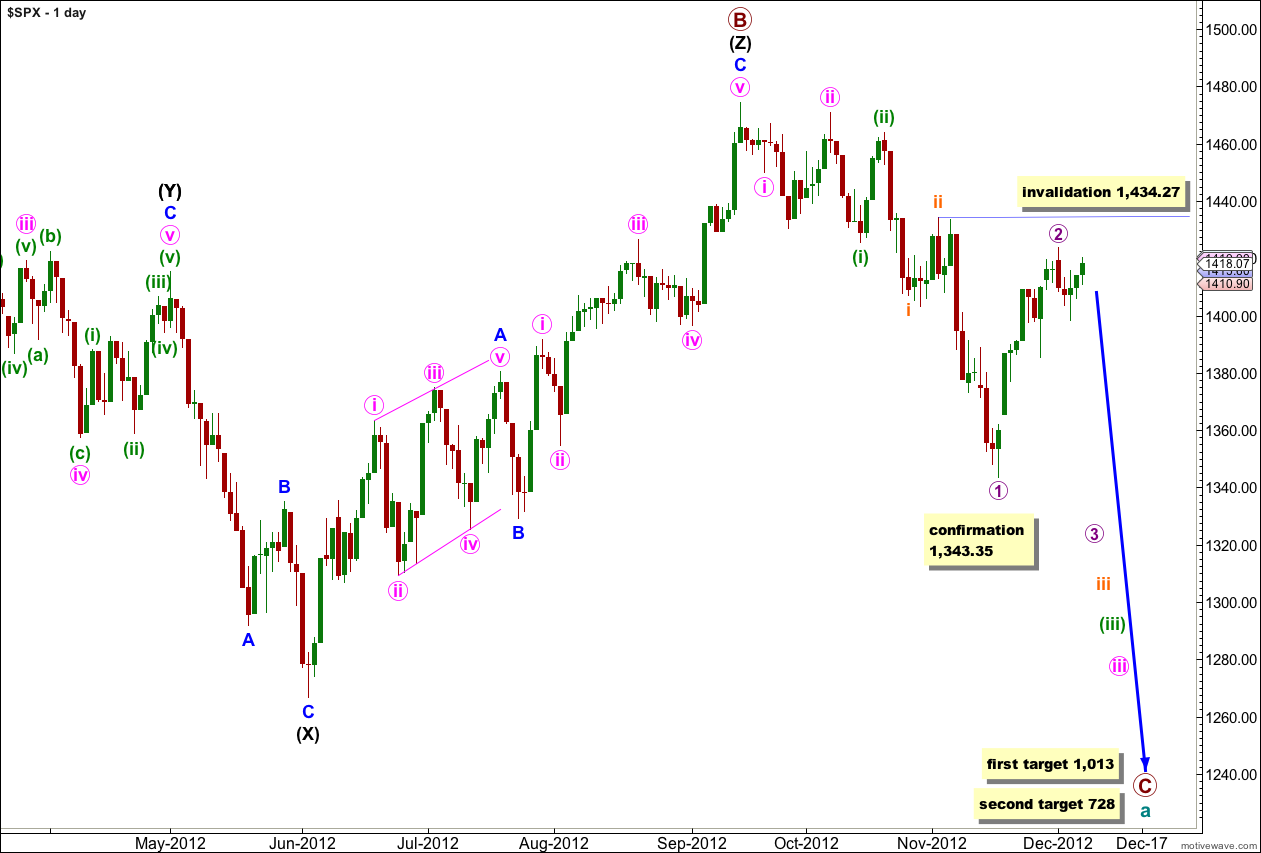
We have recently seen a major trend change in the S&P 500 and the DJIA. This wave count sees the trend at primary degree, so targets are long term and they are months away.
Within the new downwards trend we may be seeing a series of first and second overlapping waves complete. The most commonly extended wave within an impulse is the third wave, and within wave iii pink we should expect wave (iii) green to likely be extended. This necessarily begins with a series of overlapping first and second waves, and this wave count has a very typical look.
Cycle wave a is an expanded flat correction: primary wave A was a three wave structure, and primary wave B was a triple zigzag and 140% the length of primary wave A.
At 1,013 primary wave C would reach 1.618 the length of primary wave A. If price continues downwards through this first target then the next target is at 728 where primary wave C would reach 2.618 the length of primary wave A.
I have tried to see various combinations of a leading diagonal in the first waves after the high of 1,474.51 labeled primary wave B. I cannot find a scenario which fits expected wave lengths for a diagonal, and it would be neither expanding nor contracting. This scenario charted has a much higher probability.
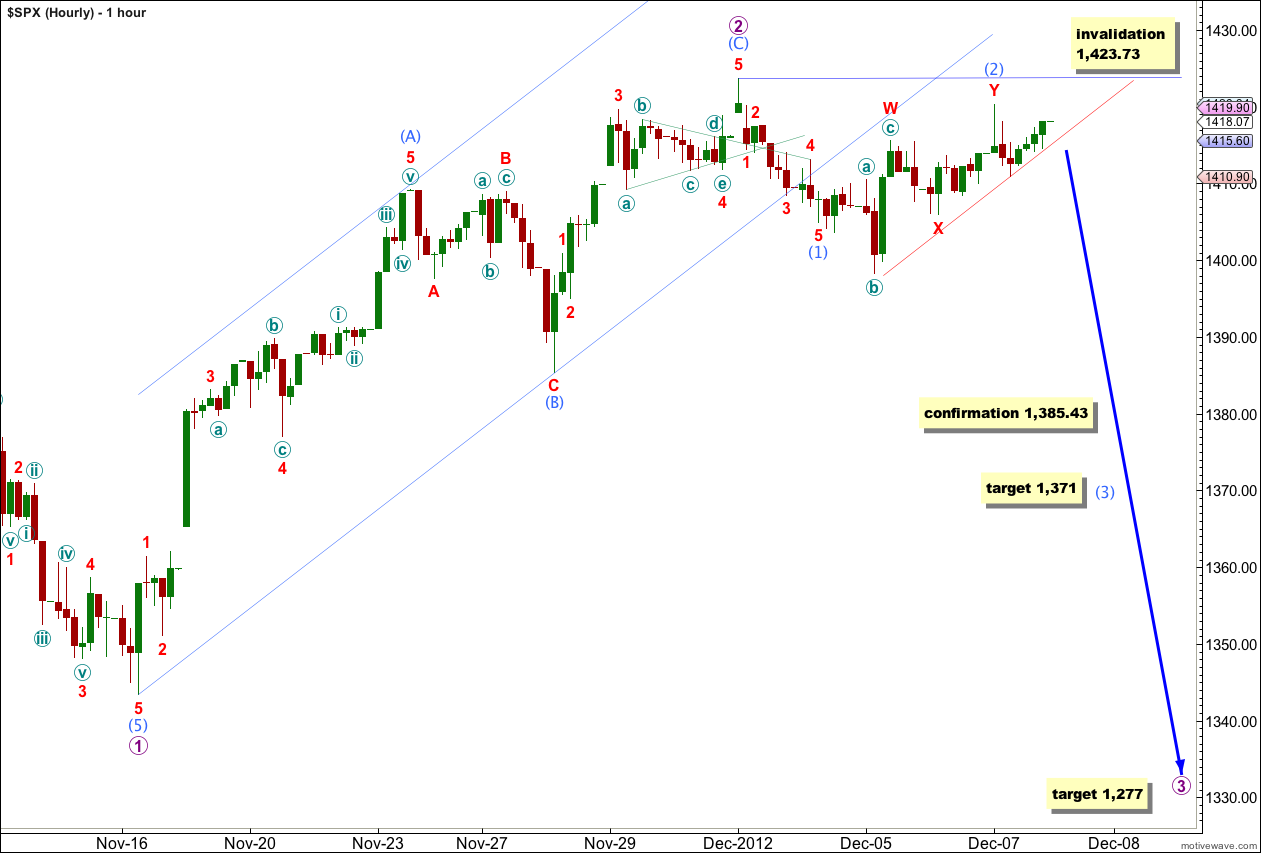
Movement above 1,415.56 was not expected but was allowed for as an outlying possibility. At this stage wave (2) aqua is a double combination: flat – X – zigzag.
It is still reasonably in proportion to wave (1) aqua, but it it lasts any longer it will start to look out of proportion. Wave (1) aqua lasted 2 days and so far wave (2) aqua has lasted 3 days.
Wave (3) aqua must move below the end of wave (1) aqua at 1,404.98. At 1,371 wave (3) aqua would reach 2.618 the length of wave (1) aqua.
Although movement from the high labeled wave 2 purple looks corrective so far this wave count remains valid, and sometimes this is how first and second waves unfold. First waves often lack momentum.
A copy of the parallel trend line containing wave 2 purple shows a line of support for the last two sessions.
Wave (2) aqua may not move beyond the start of wave (1) aqua. This wave count is invalidated with movement above 1,423.73.
At 1,277 wave 3 purple would reach 1.618 the length of wave 1 purple.
Waves 1 and 2 purple both lasted 10 sessions. I would expect wave 3 purple to be extended and so be longer in duration.
If the high of wave 2 purple remains intact and price moves lower from here this wave count will increase in probability. Movement below 1,343.35 would increase the probability of this wave count significantly.
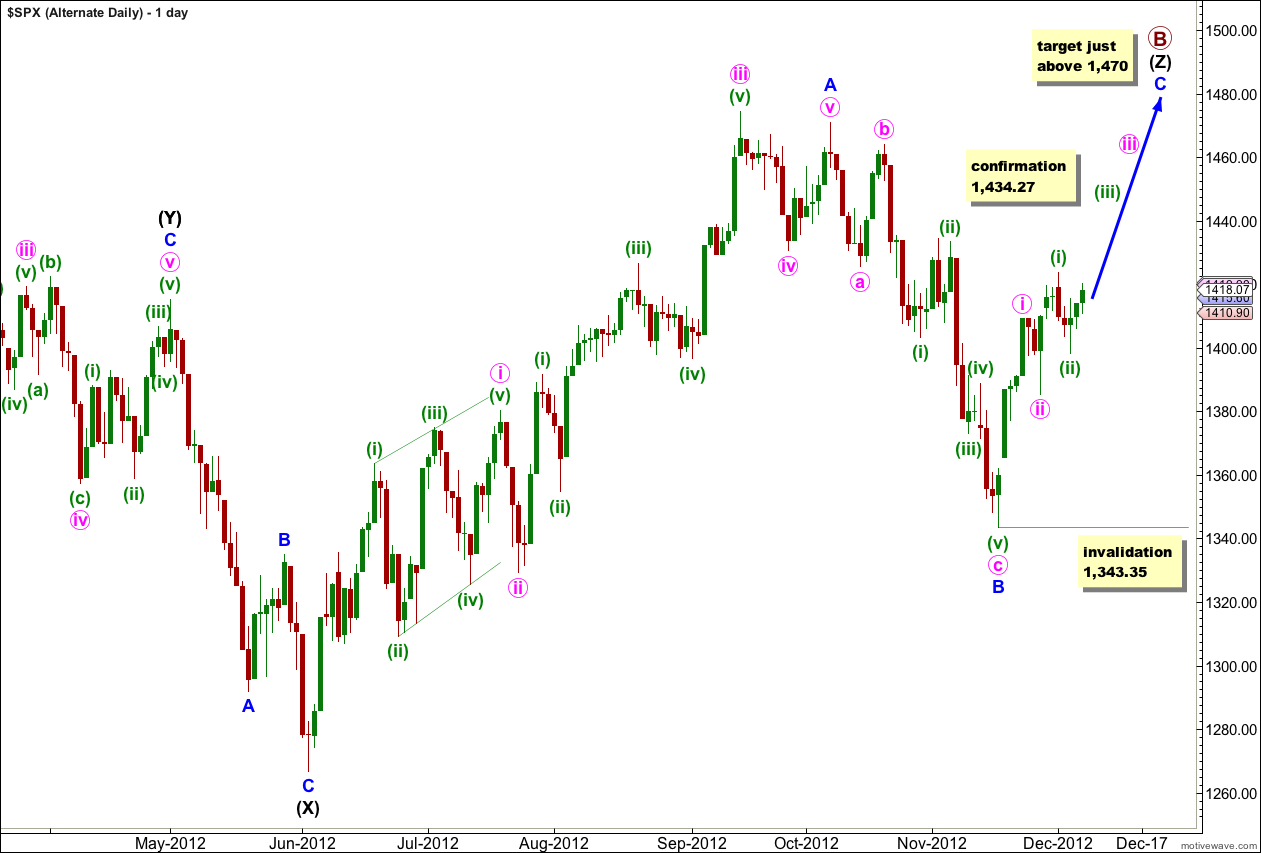
Alternate Daily Wave Count.
If price moves above 1,434.27 this alternate may be correct.
The structure for primary wave B is the same and this wave count is the same at the monthly chart level up to the start of wave (Z) black, the third zigzag in the triple.
Wave (Z) black may be incomplete and may be unfolding as a more exaggerated zigzag.
Wave A blue must be truncated to subdivide into a five wave structure.
The following problems with this wave count reduce its probability:
1. The subdivision of wave iv pink within wave A blue: wave C within this zigzag does not subdivide into a five and looks very strongly like a three (which fits the main wave count nicely).
2. If wave (Z) black is incomplete and moves higher then primary wave B may be even longer than 140% of primary wave A (the length of primary B in relation to A for the main wave count) which is over the common maximum length of 138%. For it to be further lengthened is unlikely.
3. Wave v pink of wave A blue is truncated.
Within wave C blue no second wave correction may move beyond the start of its first wave. This wave count is finally invalidated with movement below 1,343.35 (no matter how wave C blue is labeled).
This alternate expects a strong third wave upwards. If price moves above the invalidation point on the hourly chart at 1,423.73 then this wave count expects it should quickly also move above 1,434.27 as upwards momentum increases.
At 1,470 wave C blue would reach 0.618 the length of wave A blue. About this point primary wave B would also be only 139% of primary wave A. Movement to slightly above 1,470 would avoid a truncation and keep the length of primary wave B closer to the common maximum.


