
Last week’s analysis expected downwards movement for the main wave count, with increasing momentum. We had an alternate hourly wave count which allowed for more upwards movement. Price movement above 13,026.84 invalidated the main hourly wave count leaving only the alternate wave count.
At that stage we expected more upwards movement to a short term target at 13,183. Price moved higher and so far is 27.87 points short of the target.
I have the same daily wave count with its now only hourly wave count for you this week. I also have an alternate wave count for the daily chart.
Click on the charts below to enlarge.
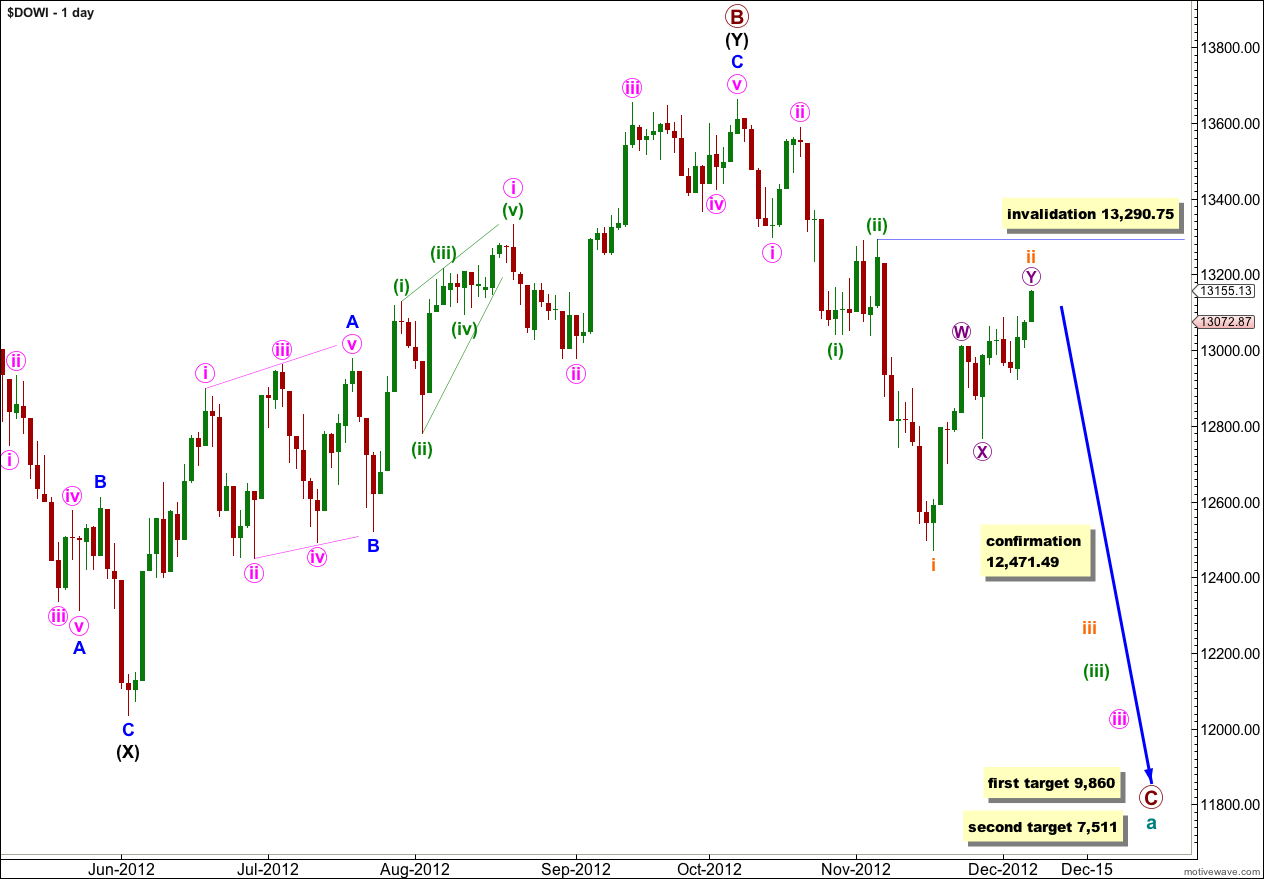
At the monthly chart level this wave count sees a common structure of a double flat unfolding at super cycle degree, and within the second flat primary waves A and B are complete. Primary wave B is a 139% correction of primary wave A.
Downwards movement is moving towards the middle of a third wave for iii pink with so far a series of overlapping first and second waves.
This is a very common scenario, because it is most commonly the third wave which is extended and this is preceded by a series of first and second waves.
Wave ii orange may not move beyond the start of wave i orange. This wave count is invalidated with movement above 13,290.75.
Targets for wave C at primary degree are long term; they are months away. At 9,860 primary wave C would reach 1.618 the length of primary wave A. At 7,511 primary wave C would reach 2.618 the length of primary wave A.
Within the new downwards movement wave ii orange has so far lasted 14 days. Wave i orange lasted 8 days.
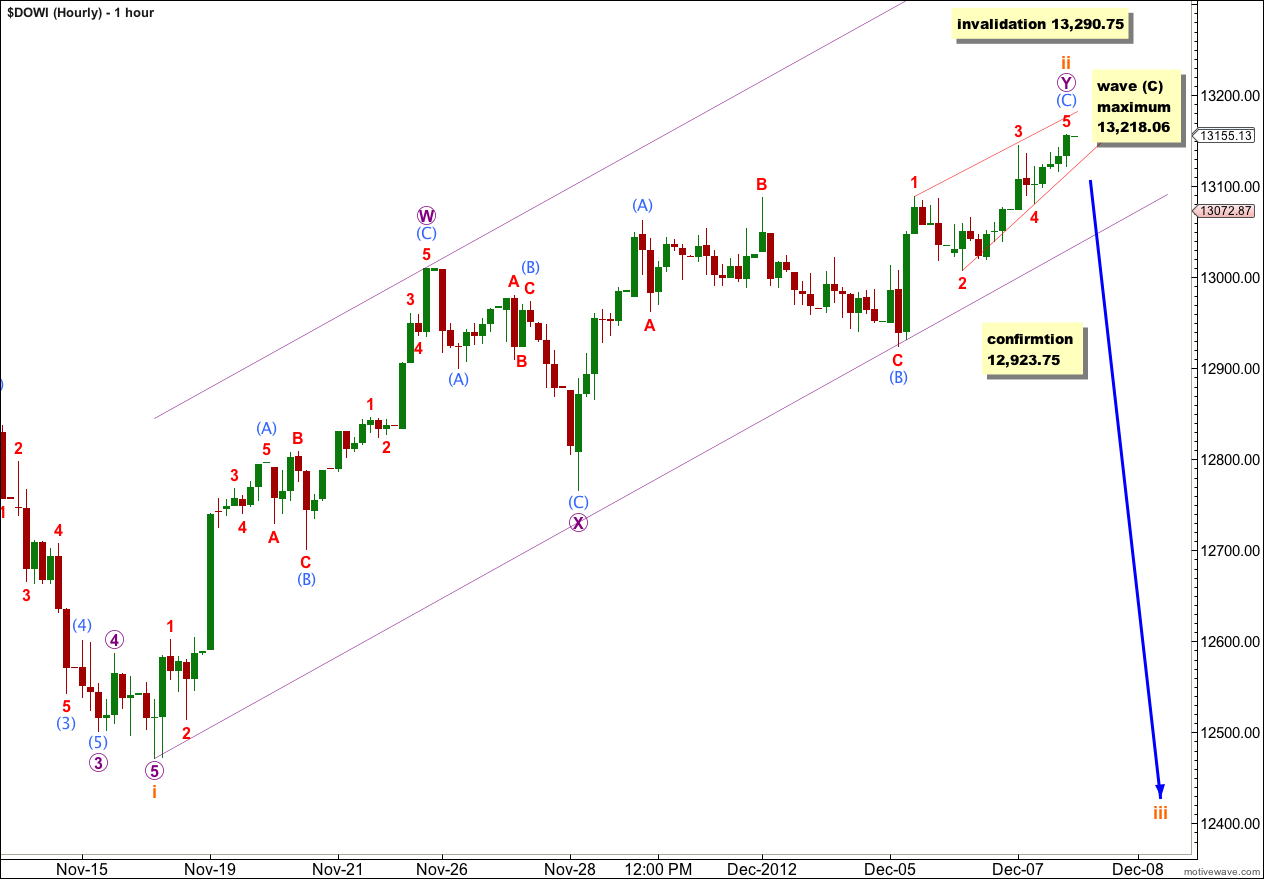
Wave ii orange may be continuing as a double zigzag structure. The purpose of double zigzags is to deepen a correction which is what this one is doing.
Within wave Y purple, the second zigzag in the double, wave (C) aqua may be an ending diagonal. On the 5 minute chart all subwaves can be seen as zigzags and it does have a reasonably typical rising wedge look to it. The diagonal is contracting: wave 3 red is shorter than wave 1 red, and wave 4 red is shorter than wave 2 red. Wave 5 red may not be longer than wave 3 red (because a third wave can never be the shortest wave) and wave 5 red has its maximum length at 13,218.06.
Movement below 12,923.75 would confirm an end to wave ii orange as at that stage the second zigzag of wave Y purple would have to be over.
Wave ii orange may not move beyond the start of wave i orange. This wave count is invalidated with movement above 13,290.75.
If this wave count is invalidated with upwards movement then we should use the alternate below.
Alternate Daily Wave Count.
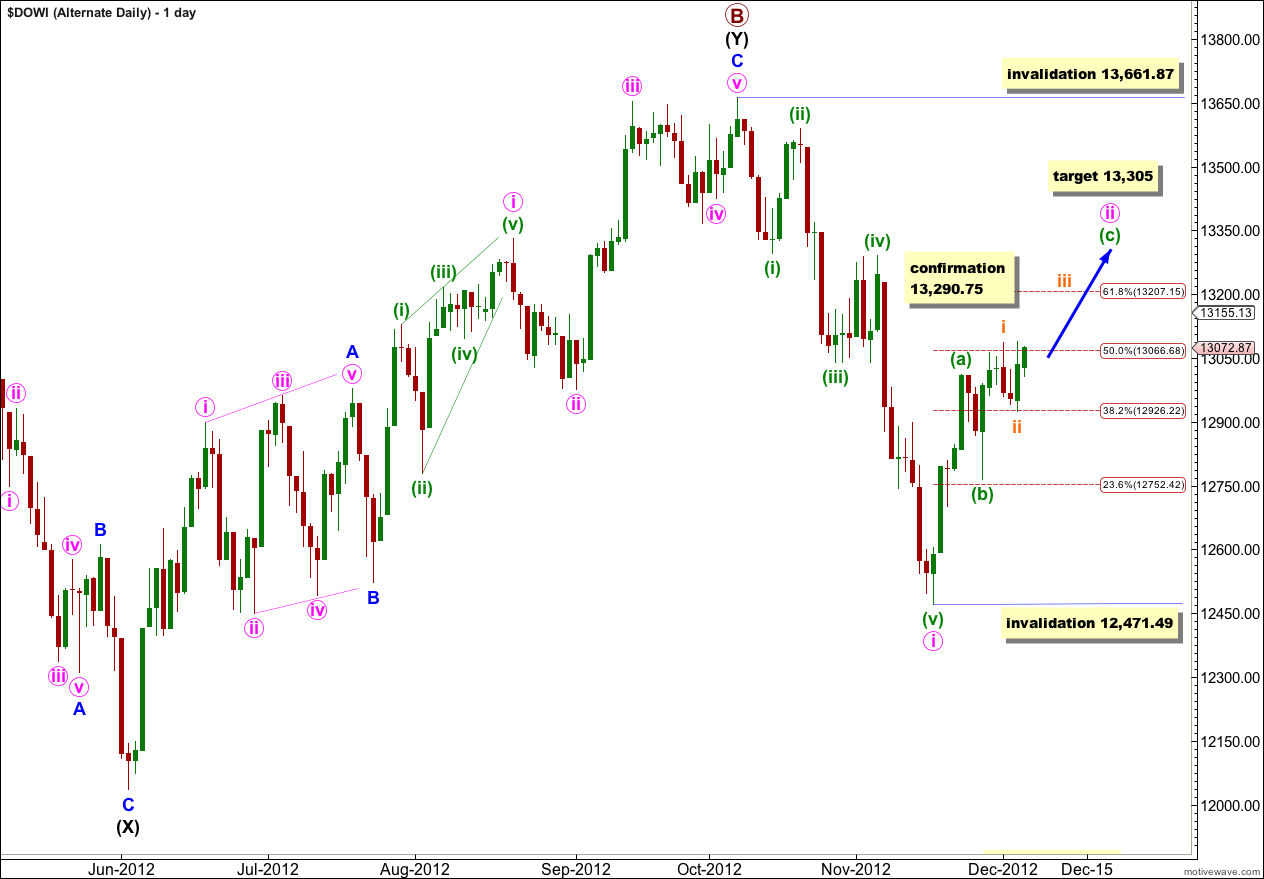
An alternate for the Dow is obvious. Movement from the high labeled primary wave B at 13,661.87 subdivides nicely into a five wave impulse. This may be wave i pink complete.
Upwards movement may be wave ii pink.
Wave i pink lasted 28 days. So far wave ii pink would have lasted only 13 days. We would expect it to continue higher and be longer in duration in order to be better in proportion to wave i pink.
If upwards movement is a larger degree second wave and the structure is most likely a zigzag because wave (a) green subdivides into a five. Price would be moving into the middle of a third wave upwards for wave (c) green of the zigzag.
If price moves above 13,290.75 then expect momentum to increase upwards. At 13,305 wave (c) green would reach equality in length with wave (a) green and price would be over the 0.618 Fibonacci ratio of wave i pink at 13,207.
Within wave ii pink wave (b) green may not move beyond the start of wave (a) green (if wave (b) green is not over and is continuing further as an expanded flat correction).
Wave ii pink may not move beyond the start of wave i pink. This wave count is invalidated with movement above 13,661.87.