
Recently I have switched the order of the monthly wave counts back to what was my main wave count for a very long time.
The main wave count has the most common structure and so has the highest probability.
As each of the two alternates is invalidated the probability for the main wave count will increase.
Click on the charts below to enlarge.
Main Monthly Wave Count.
This is the wave count that I had as a main wave count for a long time.
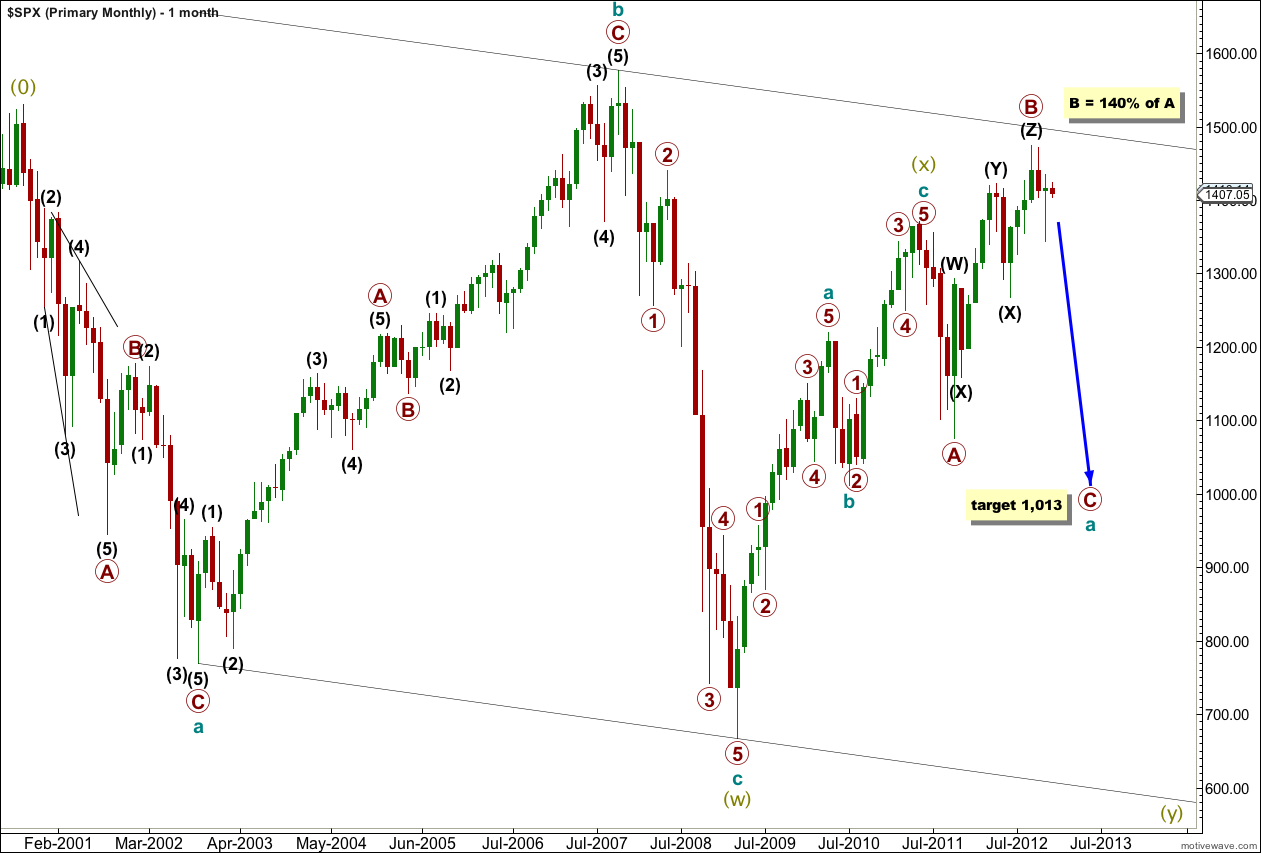
At grand supercycle degree a double flat is unfolding. This is a fairly common structure.
Within the double flat the first structure labeled wave (w) olive green is complete. The three in the opposite direction is a zigzag labeled wave (x) olive green. The second flat in the double labeled wave (y) olive green has begun.
Although super cycle wave (x) lasts only 2.5 years the duration of all other waves fits very well indeed. Overall also it has a typical look. I am prepared to have a main wave count with a brief super cycle X wave for these reasons, particularly as duration for wave degrees is a guideline for form and not a rule.
Within super cycle wave (y) olive green cycle wave a is unfolding as a three wave structure, itself a flat correction.
Within cycle wave a primary wave A down was a three and now primary wave B upwards is also a three. Primary wave B is a 140% correction of primary wave A. The maximum common length of B in relation to A within a flat is 138%, with only 2% above this maximum this wave count still has a very reasonable probability. There is no maximum allowable length of B in relation to A for a flat correction.
Within primary wave B the structure is best seen as a triple zigzag.
Alternate Monthly Wave Count.
This wave count was an alternate monthly wave count that I have had for some time.
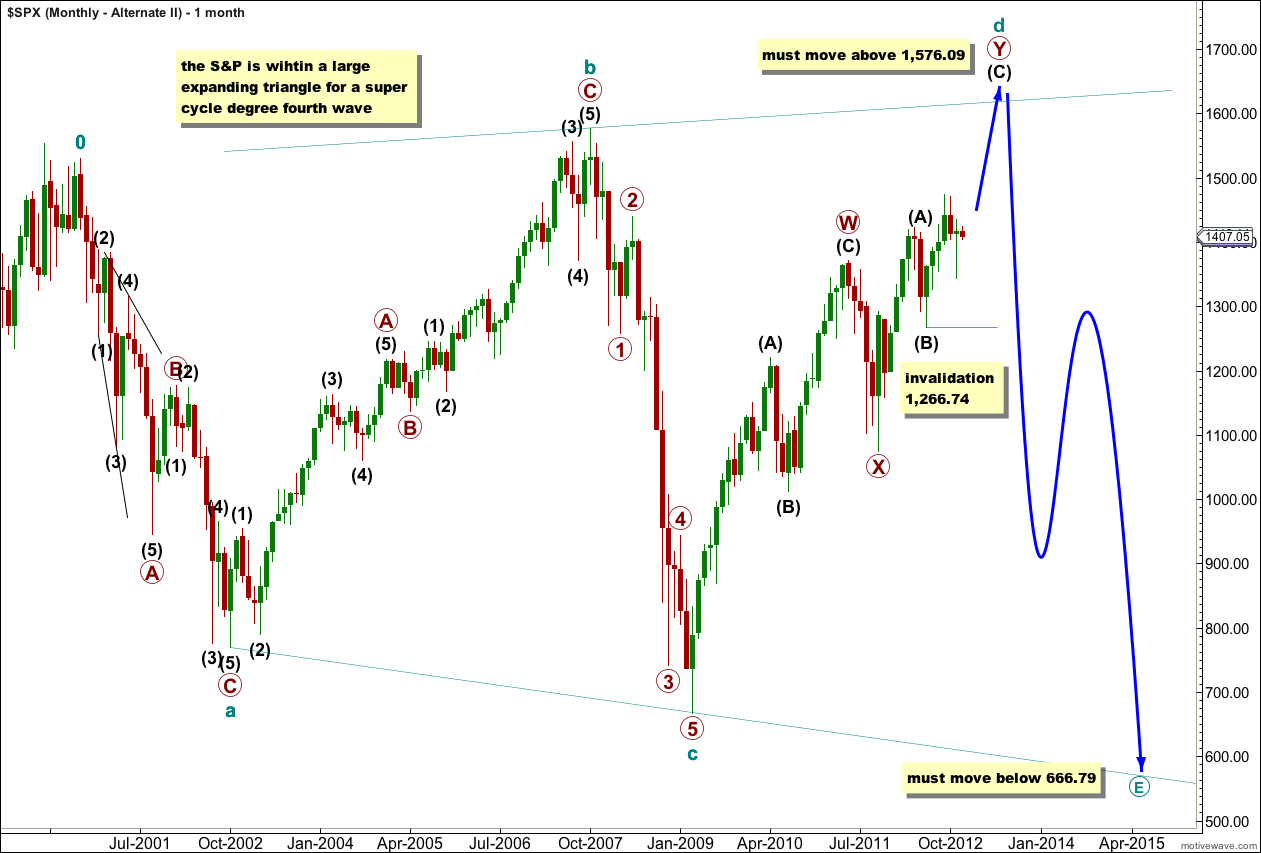
Expanding triangles are the rarest of all Elliott wave structures. This reduces the probability of this wave count.
At super cycle degree this wave count sees an expanding triangle unfolding. Within the triangle cycle wave d is unfolding as a longer lasting and more complicated double zigzag structure.
Within this double zigzag the second zigzag labeled primary wave Y is incomplete.
Within primary wave Y wave (C) black is incomplete.
The triangle is expanding because cycle wave c ended below the low of cycle wave a. Within an expanding triangle wave d must move beyond the end of wave b, so cycle wave d must make a new all time high above 1,576.09.
When cycle wave d is complete (which would take another few months) then cycle wave e should crash to new lows. Cycle wave e must move price below the end of cycle wave c at 666.79.
To the downside within wave (C) black no second wave correction may move beyond the start of its first wave. This wave count is invalidated with movement below 1,266.74 in the mid term.
Second Alternate Monthly Wave Count.
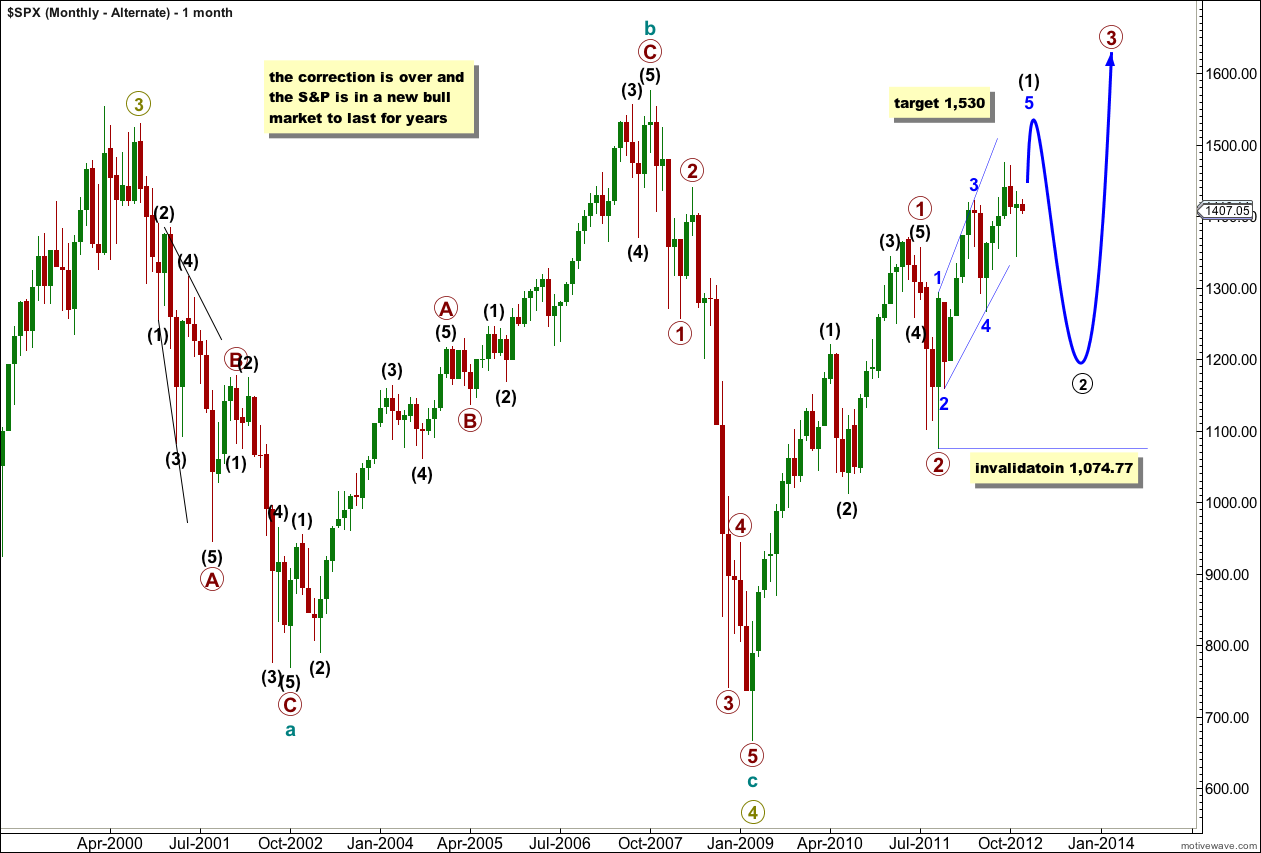
Finally, it is just possible that the S&P 500 is in a new five wave structure upwards which will continue to new highs and has no upper limit.
This wave count I consider to have a very low probability because the upwards movement labeled here primary wave 1 from the low of 666 in March 2009 to the high of 1,370.58 in May 2011 (which was not the end of the structure but is the price high) looks very much like a three wave structure on monthly, weekly and daily charts.
Trying to see this as a five and not a three seems to be too elastic with rules of Elliott wave and does not take into account the “right look”. I will only consider this possibility because I want to consider all options, and because very occasionally a movement looks like a three or five only to later show that it was the other. However, I can accept this happening sometimes on hourly charts, but on daily weekly and monthly charts it is a big stretch.
This is a long wave with many subdivisions. Unfortunately, it cannot be absolutely determined as either a three or a five and it is open to some debate.
If this wave count is correct then the end of the “credit crunch” was probably a fourth wave at super cycle degree, and it was an expanded flat correction. The subdivisions here fit perfectly and this structure does look very much like a flat, with a nice strong C wave to end it.
Thereafter, we may be in the early stages of a new bull market to last another decade or so.
Within that new bull market primary waves 1 and 2 would be over. Primary wave 3 may have begun with a leading diagonal for its first wave, intermediate wave (1) which is incomplete. At 1,530 wave 5 blue would reach equality with wave 3 blue. Because the diagonal is expanding wave 5 should end at or above this target. Thereafter we should expect a very deep second wave correction for black wave (2).
Wave (2) black may not move beyond the start of wave (1) black. This wave count is invalidated with movement below 1,074.77. This price point differentiates this outlying alternate with our second wave count which expects movement below this point.