
Last analysis expected a small second wave correction to take price higher during Wednesday’s session, and to end during the session or possibly to take most of the session. Price reached higher as expected.
The wave count remains the same with just the one daily and hourly wave count unfolding so far as expected.
Click on the charts below to enlarge.
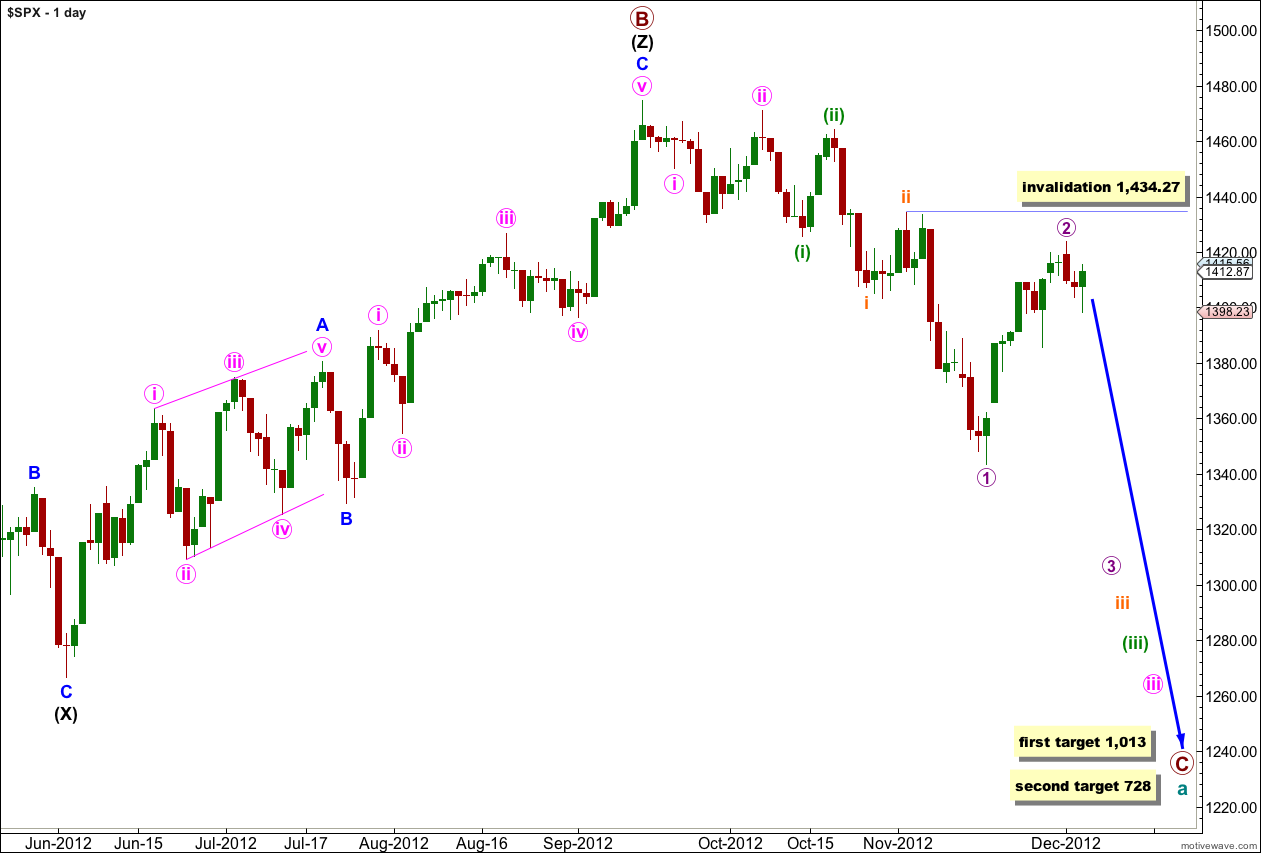
We have recently seen a major trend change in the S&P 500 and the DJIA. This wave count sees the trend at primary degree, so targets are long term and they are months away.
Within the new downwards trend we may be seeing a series of first and second overlapping waves complete. The most commonly extended wave within an impulse is the third wave, and within wave iii pink we should expect wave (iii) green to likely be extended. This necessarily begins with a series of overlapping first and second waves, and this wave count has a very typical look.
Cycle wave a is an expanded flat correction: primary wave A was a three wave structure, and primary wave B was a triple zigzag and 140% the length of primary wave A.
At 1,013 primary wave C would reach 1.618 the length of primary wave A. If price continues downwards through this first target then the next target is at 728 where primary wave C would reach 2.618 the length of primary wave A.
I have tried to see various combinations of a leading diagonal in the first waves after the high of 1,474.51 labeled primary wave B. I cannot find a scenario which fits expected wave lengths for a diagonal, and it would be neither expanding nor contracting. This scenario charted has a much higher probability.
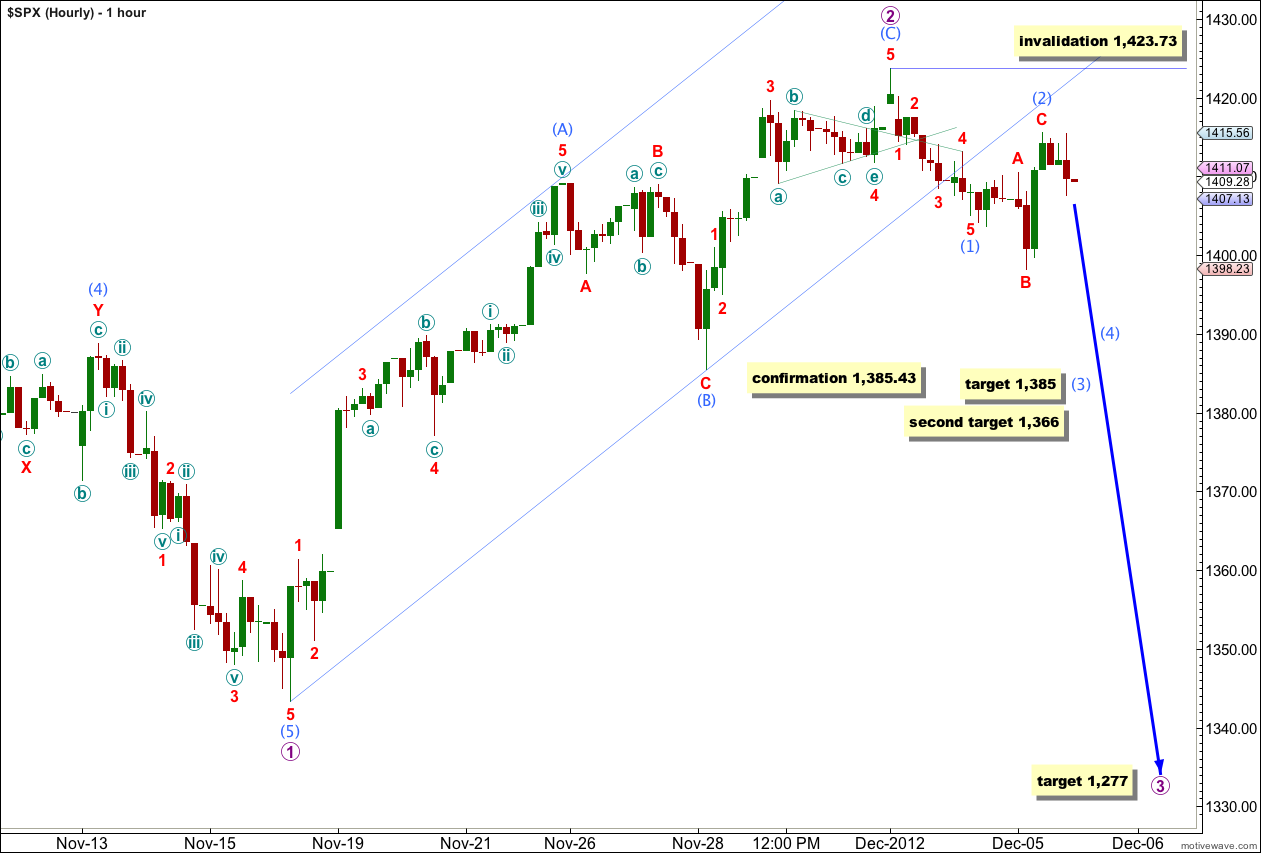
Wave (2) aqua moved price higher as expected. The structure looks most like an expanded flat correction. Wave B red is just over twice the length of wave A red and wave C red has no Fibonacci ratio to wave A red (it is over 2.618 the length of wave A red).
On the 5 minute chart the subdivisions within wave (2) aqua are correct: 3-3-5.
Wave (3) aqua may have begun at the end of Wednesday’s session. If this is correct then tomorrow’s session should see an increase in downwards momentum.
If wave (2) aqua is over now then it is nicely in proportion to wave (1) aqua. However, there is an outlying possibility that wave (2) aqua could continue further sideways as a double flat or double combination. If it did then we should not expect price to move much higher than 1,415.56 because the purpose of a double flat or double combination is to move price sideways and take up time, not to deepen a correction. This possibility has a low probability though.
At 1,385 wave (3) aqua would reach 1.618 the length of wave (1) aqua. If price continues through this first target then we should use the second. At 1,366 wave (3) aqua would reach 2.618 the length of wave (1) aqua. This short term target may be met within a few days.
At 1,277 wave 3 purple would reach 1.618 the length of wave 1 purple. This mid term target may be about a couple of weeks away.
If wave (2) aqua does continue as a double then it may not move beyond the start of wave (1) aqua. This wave count is invalidated with movement above 1,423.73.
Movement below 1,385.43 would provide strong confirmation of a trend change and the start of the third wave for 3 purple.