
Last analysis expected downwards movement from Tuesday’s session which is exactly what happened.
Today I have just the one daily and one hourly wave count for you. The invalidation point and target is the same as yesterday.
Note: For members who are also members of Elliott Wave Forex and receive Hugo’s EURUSD analysis, this is an answer to the questions I have received about Hugo’s new bullish wave count:
EURUSD and S&P 500 do not have to move together. From a pure Elliott wave perspective they are separate markets and have separate wave counts.
I have looked at Hugo’s new monthly chart and have been in communication with him. I disagree with his order of wave counts. I would swap them around and his alternate would be my main (with an adjustment I’ve spoken about with him).
Additionally, I have a bullish alternate for the monthly S&P 500 although I think it has a very low probability.
Click on the charts below to enlarge.
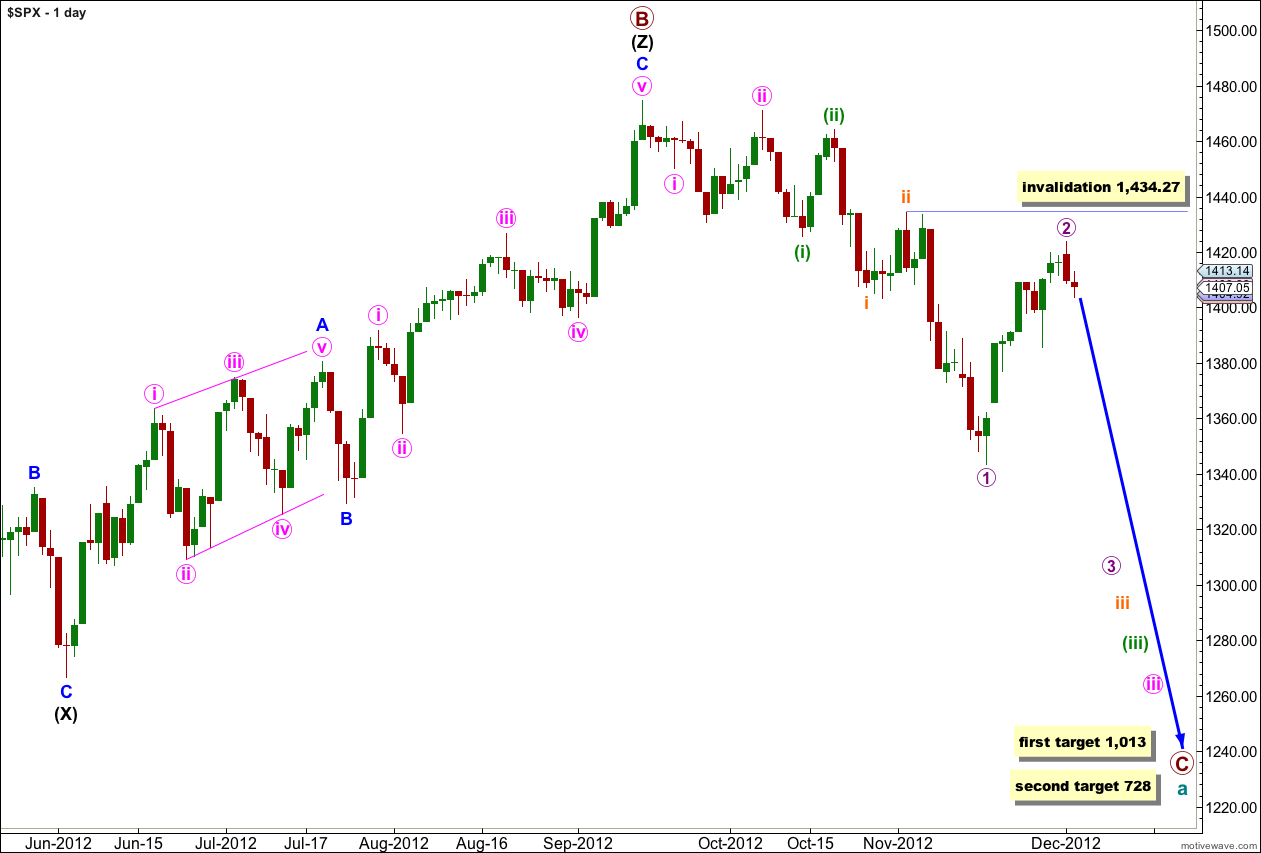
We have recently seen a major trend change in the S&P 500 and the DJIA. This wave count sees the trend at primary degree, so targets are long term and they are months away.
Within the new downwards trend we may be seeing a series of first and second overlapping waves complete. The most commonly extended wave within an impulse is the third wave, and within wave iii pink we should expect wave (iii) green to likely be extended. This necessarily begins with a series of overlapping first and second waves, and this wave count has a very typical look.
Cycle wave a is an expanded flat correction: primary wave A was a three wave structure, and primary wave B was a triple zigzag and 140% the length of primary wave A.
At 1,013 primary wave C would reach 1.618 the length of primary wave A. If price continues downwards through this first target then the next target is at 728 where primary wave C would reach 2.618 the length of primary wave A.
I have tried to see various combinations of a leading diagonal in the first waves after the high of 1,474.51 labeled primary wave B. I cannot find a scenario which fits expected wave lengths for a diagonal, and it would be neither expanding nor contracting. This scenario charted has a much higher probability.
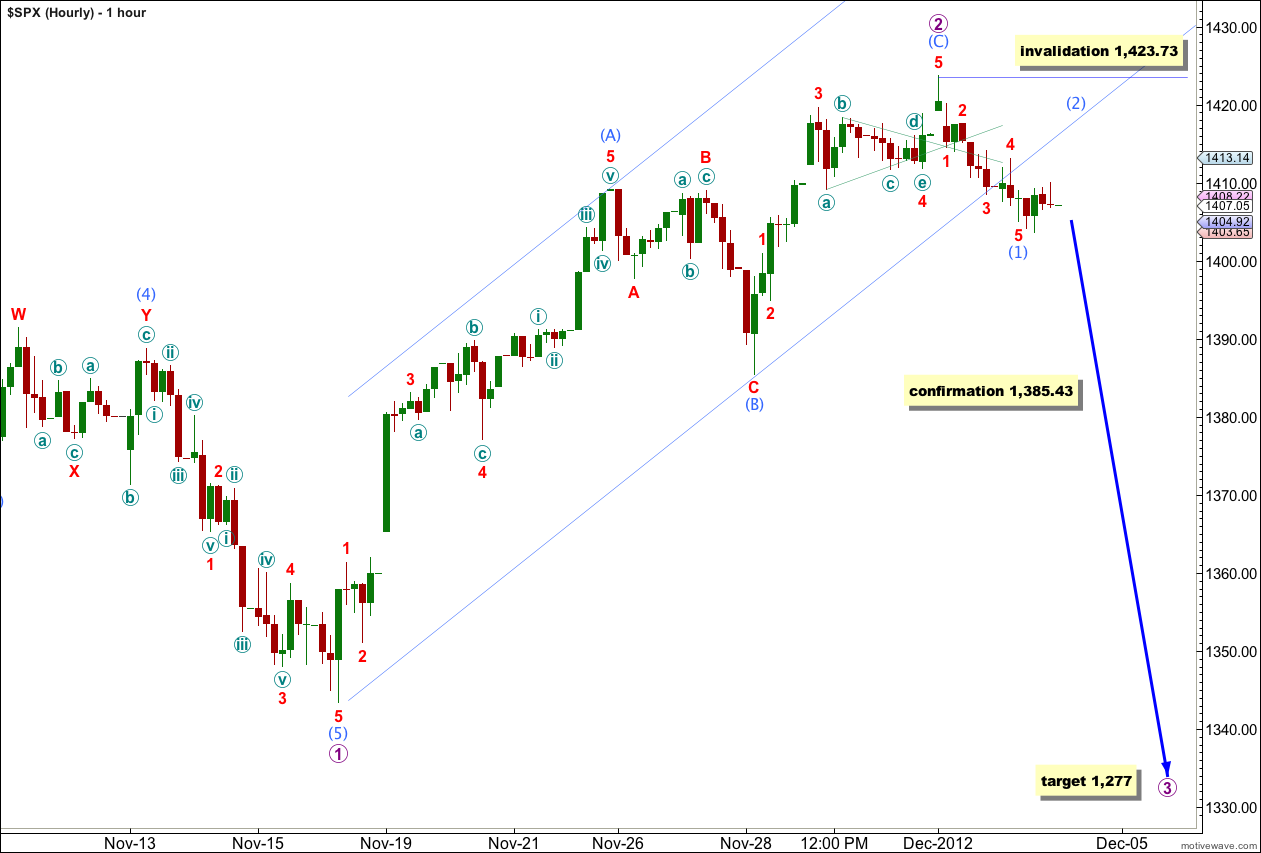
Because the same invalidation point, the same target, and an expectation of an impulse downwards for a strong third wave apply to yesterday’s main and alternate hourly wave counts, which remain valid, we will only use the main hourly count today.
So far downwards movement has an impulsive count of 13 on the 5 minute chart. A first wave down may be complete and a second wave upwards for (2) aqua may have begun at the end of Tuesday’s session.
Ratios within wave (2) aqua are: wave 3 red is 0.61 points short of equality with wave 1 red, and wave 5 red has no Fibonacci ratio to either of waves 1 or 3 red.
There is now a very clear channel breach of the channel drawn about wave 2 purple, indicating that wave 2 is over and wave 3 has begun.
Movement below 1,385.43 would provide further confidence in a trend change as at that stage downwards movement may not be a second wave correction within wave (C) aqua of wave 2 purple, and so wave (C) aqua would have to be over.
Wave 3 purple would reach 1.618 the length of wave 1 purple at 1,277. This mid term target may be about a couple of weeks away.
Wave (2) aqua looks unlikely to be complete on the 5 minute chart and will probably move higher tomorrow. Wave (2) aqua may not move beyond the start of wave (1) aqua. This wave count is invalidated with movement above 1,423.73.