
The main hourly wave count from last week’s analysis expected the Dow to move higher in a correction for the week. That wave count had a confirmation point at 13,007.13. Price did not move above the confirmation point and instead moved lower for the week, and the alternate hourly wave count was correct.
This week I have just the one daily and one hourly wave count for you. This wave count is perfectly in line with my wave count for the S&P 500 and agrees with MACD as an indicator of momentum.
Click on the charts below to enlarge.
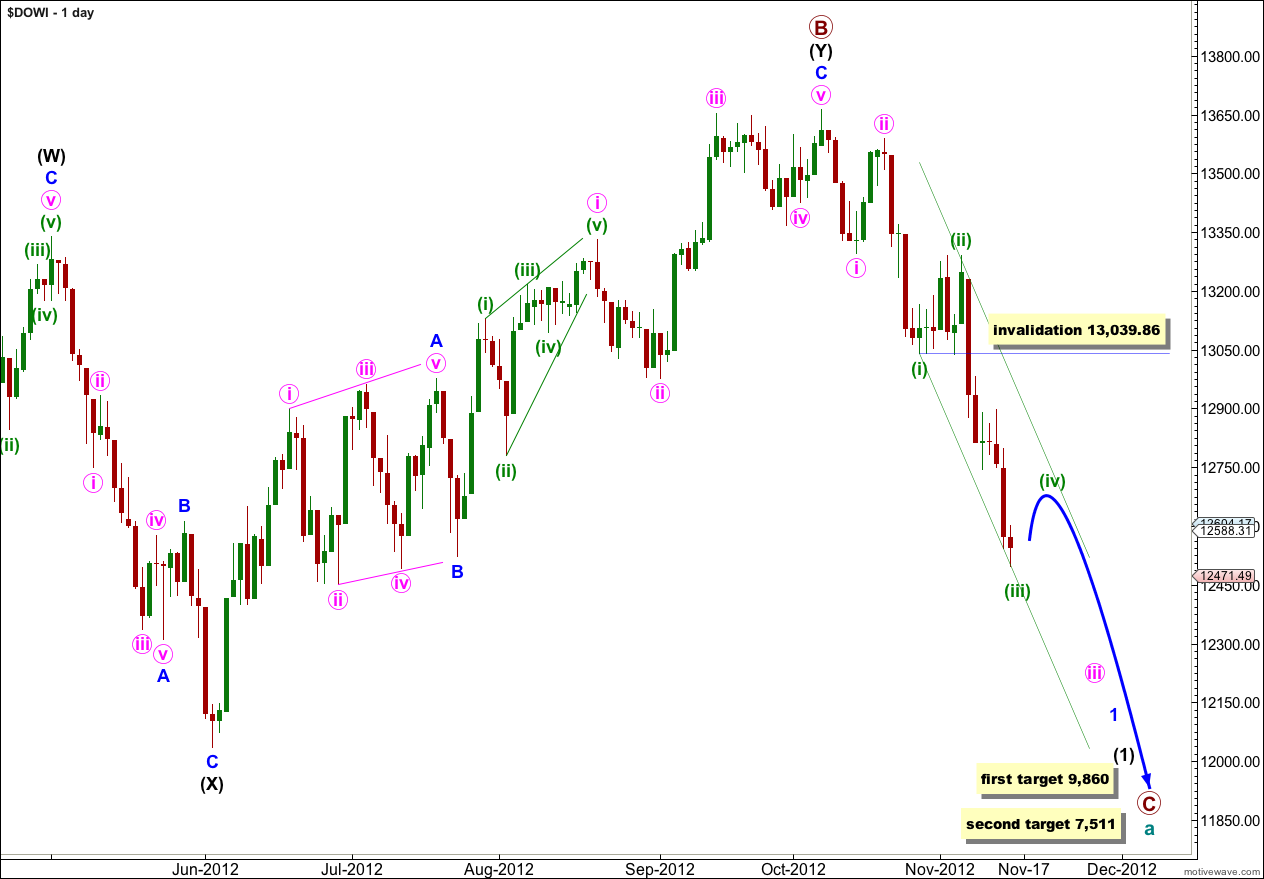
At the monthly chart level this wave count sees a common structure of a double flat unfolding at super cycle degree, and within the second flat primary waves A and B are complete. Primary wave B is a 139% correction of primary wave A.
Wave 1 blue (minor) is likely to be incomplete, and the third wave within it, wave iii pink also incomplete.
We may use Elliott’s channeling technique to draw a channel about wave iii pink: draw the first trend line from the lows of waves (i) to (iii) green, then place a parallel copy upon the high of wave (ii) green. Wave (iv) green may find resistance about the upper edge of this channel.
Wave (iv) green may not move into wave (i) green price territory. This wave count is invalidated with movement above 13,039.86.
This wave count agrees with MACD as the strongest reading coincides with the end of this third wave.
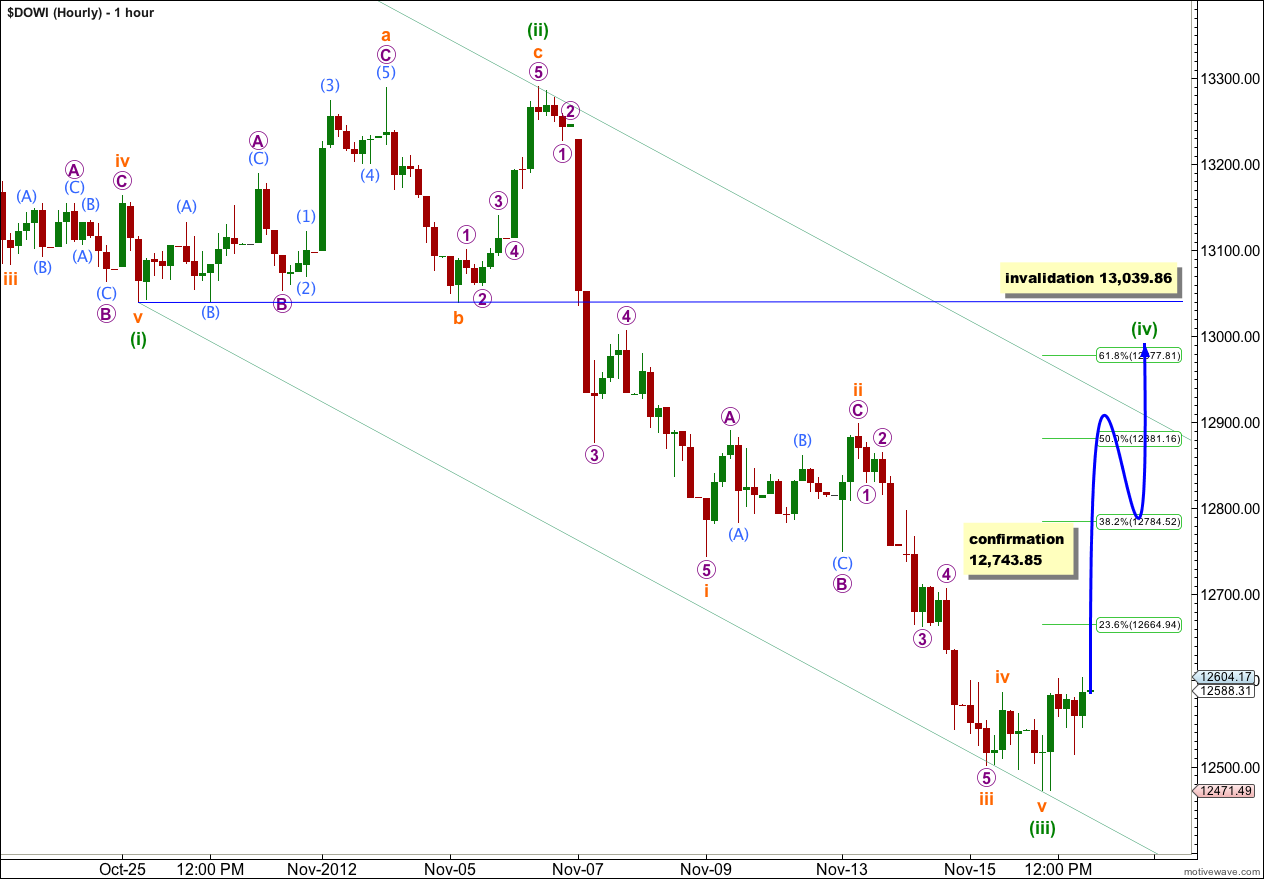
It would be wise to wait for confirmation of wave (iv) green being underway with movement above 12,743.85. That is the low of wave i orange within wave (iii) green; price movement above that point may not be an extension of wave iv orange and so wave (iii) green would have to be over.
Wave (iii) green is 68.9 points longer than 1.618 the length of wave (i) green (an 8.4% variation, less than 10%, and thus acceptable).
Ratios within wave (iii) green are: wave iii orange has no Fibonacci ratio to wave i orange, and wave v orange has no Fibonacci ratio to either of waves i or iii orange.
Wave (ii) green was a relatively shallow 46% correction of wave (i) green, and a sideways moving flat correction. We may expect wave (iv) green to be a relatively deep correction, over 50% of wave (iii) green, and most likely a sharp zigzag.
Wave (iv) green may find resistance about the upper edge of this parallel channel, or it may overshoot the channel.
Wave (ii) green lasted 6 sessions so we may expect wave (iv) green to be about the same duration.
Wave (iv) green may not move into wave (i) green price territory. This wave count is invalidated with movement above 13,039.86.