
Yesterday’s analysis expected price to move lower during Thursday’s session towards a short term target at 1,348. Downwards movement reached to 1,348.05 during the session.
I have still the same daily wave count for you today. I have two hourly wave counts which look at Thursday’s movement slightly differently. They differ only in the expectation for the very short term.
Click on the charts below to enlarge.
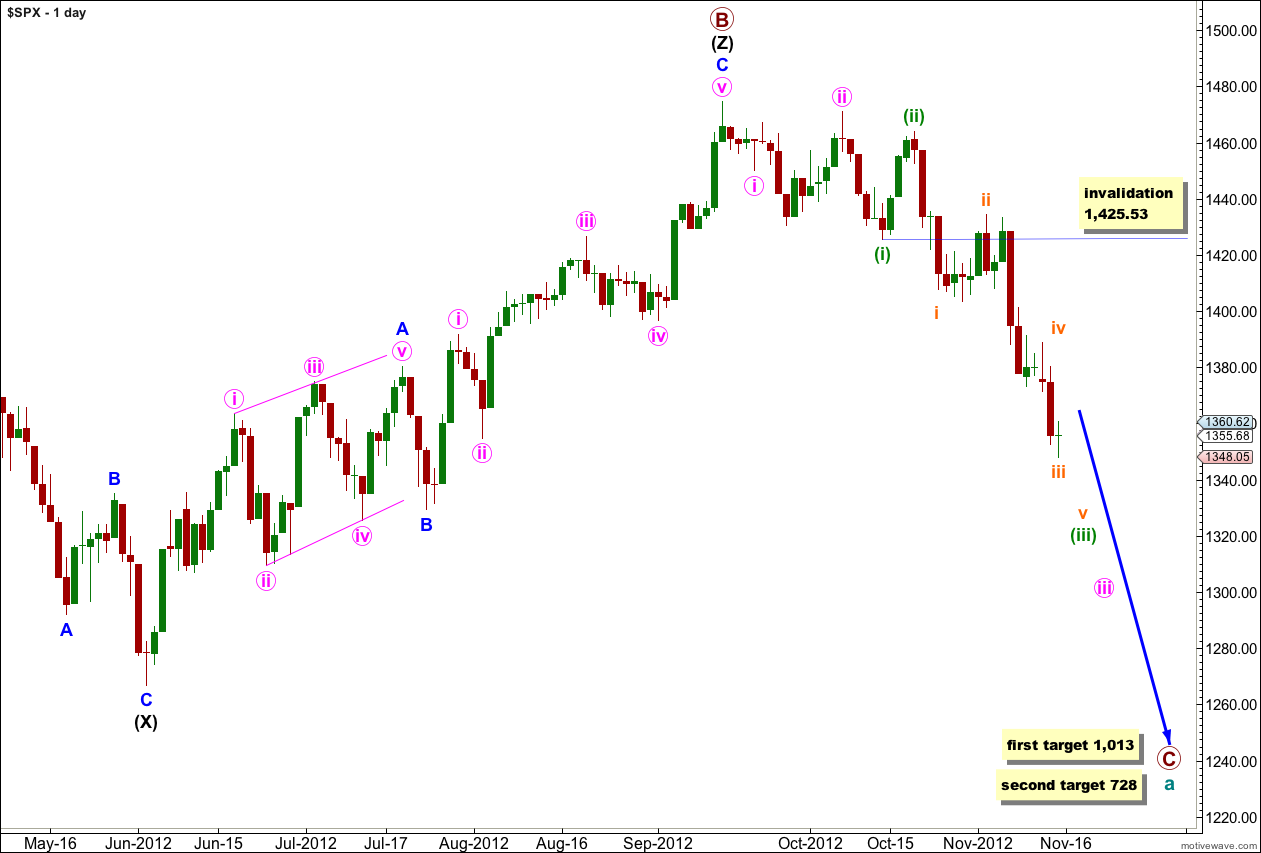
It looks highly likely that we have recently seen a major trend change in the S&P 500 and the DJIA. For both markets this trend change is confirmed.
Within the new downwards trend the upcoming wave (iv) green may not move into wave (i) green price territory. This wave count is invalidated at this stage with movement above 1,425.53.
Downwards movement looks most likely to be a series of overlapping first and second waves, with the middle of the third wave complete. We shall expect overall downwards movement with fourth wave corrections to come.
Cycle wave a is an expanded flat correction: primary wave A was a three wave structure, and primary wave B was a triple zigzag and 140% the length of primary wave A.
At 1,013 primary wave C would reach 1.618 the length of primary wave A. If price continues downwards through this first target then the next target is at 728 where primary wave C would reach 2.618 the length of primary wave A.
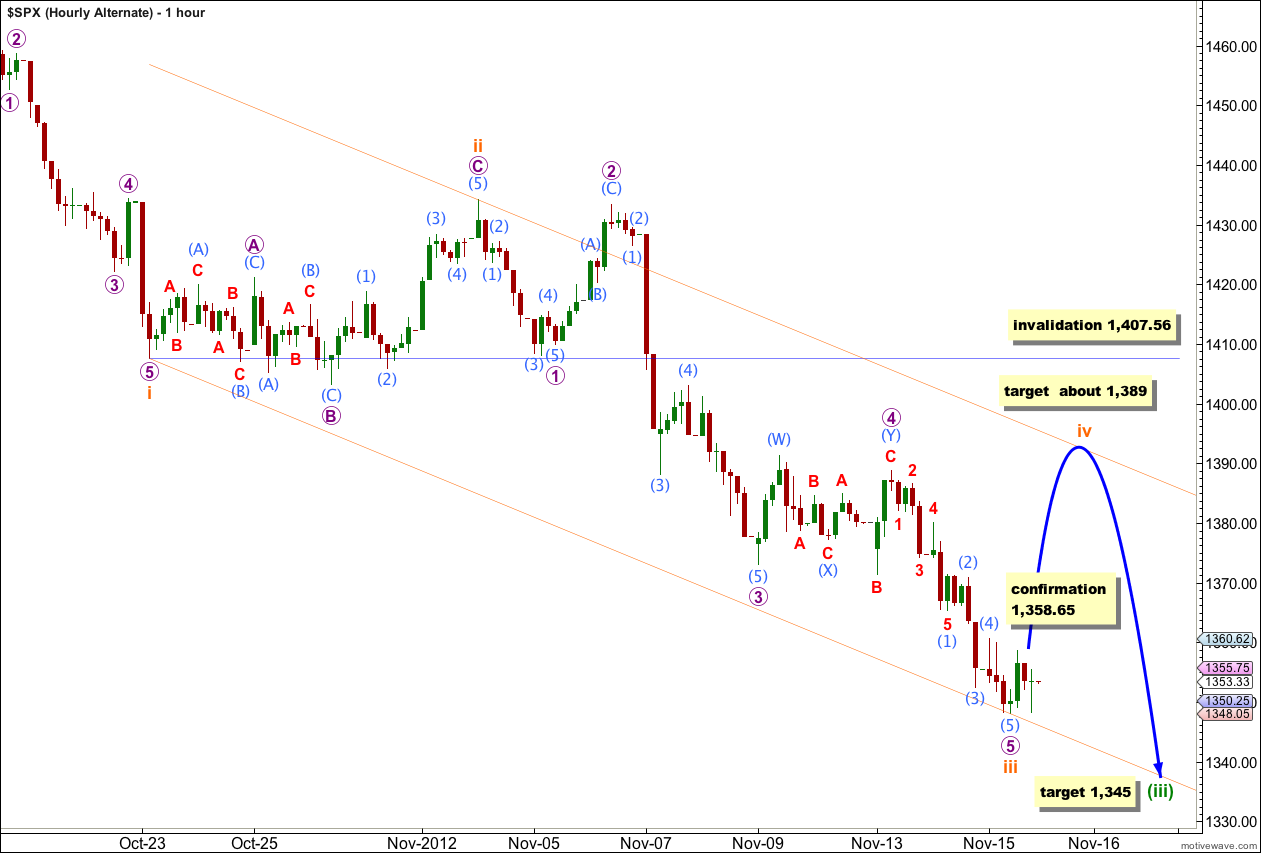
Main Hourly Wave Count.

I have adjusted the wave count at orange degree and below to fit better with MACD as an indicator of momentum. The middle of the third wave, at the end of wave 3 purple, has the strongest momentum.
This also has a better look on the daily chart as waves 2 and 4 purple are now better in proportion.
This first hourly wave count expects that wave iii orange is very close to completion. At 1,343 wave iii orange would reach 1.618 the length of wave i orange.
Within wave iii orange wave 3 purple is 3.5 points short of 2.618 the length of wave 1 purple. Because there is already a good Fibonacci ratio within the impulse of wave iii orange I would not expect to see a ratio between wave 5 purple and either of 1 or 3.
Within wave 5 purple wave (3) aqua is just 0.33 points short of equality with wave (1) aqua. Wave (5) aqua has a limit of no longer than wave (3) aqua because the third wave may never be the shortest. This limit is at 1,335.46. Because both waves (1) and (3) aqua are extended wave (5) aqua may not be extended also. At 1,344 wave (5) aqua would reach 0.618 the length of waves (1) and (3) aqua.
When wave iii orange is complete this wave count expects an upwards correction for wave iv orange. Wave ii orange was a relatively shallow 47% correction of wave i orange, and was an expanded flat structure. I would expect wave iv orange to be relatively deep, over 50%, and to be a zigzag most likely, or a double, or a combination. Wave iv orange may find resistance about the upper edge of the channel.
Wave iv orange may not move into wave i orange price territory. This wave count is invalidated with movement above 1,407.56.
Wave ii orange lasted 6 sessions. I would expect wave iv orange to also last about 6 sessions.
Alternate Hourly Wave Count.
This wave count is identical to the main hourly wave count up to the low labeled wave (1) aqua within wave 5 purple.
This wave count also fits with MACD and fits nicely on the 5 minute chart.
It is possible that wave iii orange is over and wave iv orange began at the end of Thursday’s session.
The only reason why this is my alternate is the structure of the last piece of movement from the low labeled wave iii orange; on the 5 minute chart the upwards piece subdivides nicely as a three and the downwards movement subdivides best as a five which suggests more downwards movement.
If price moves above 1,358.65 tomorrow then on the 5 minute chart this wave count would be confirmed.