
Last analysis expected upwards movement to begin Wednesday’s session, before the resumption of the downwards trend towards the target on the hourly chart. The amount and duration of upwards movement was in question.
However, price simply moved lower during Wednesday’s session and is now much closer to the target.
Click on the charts below to enlarge.
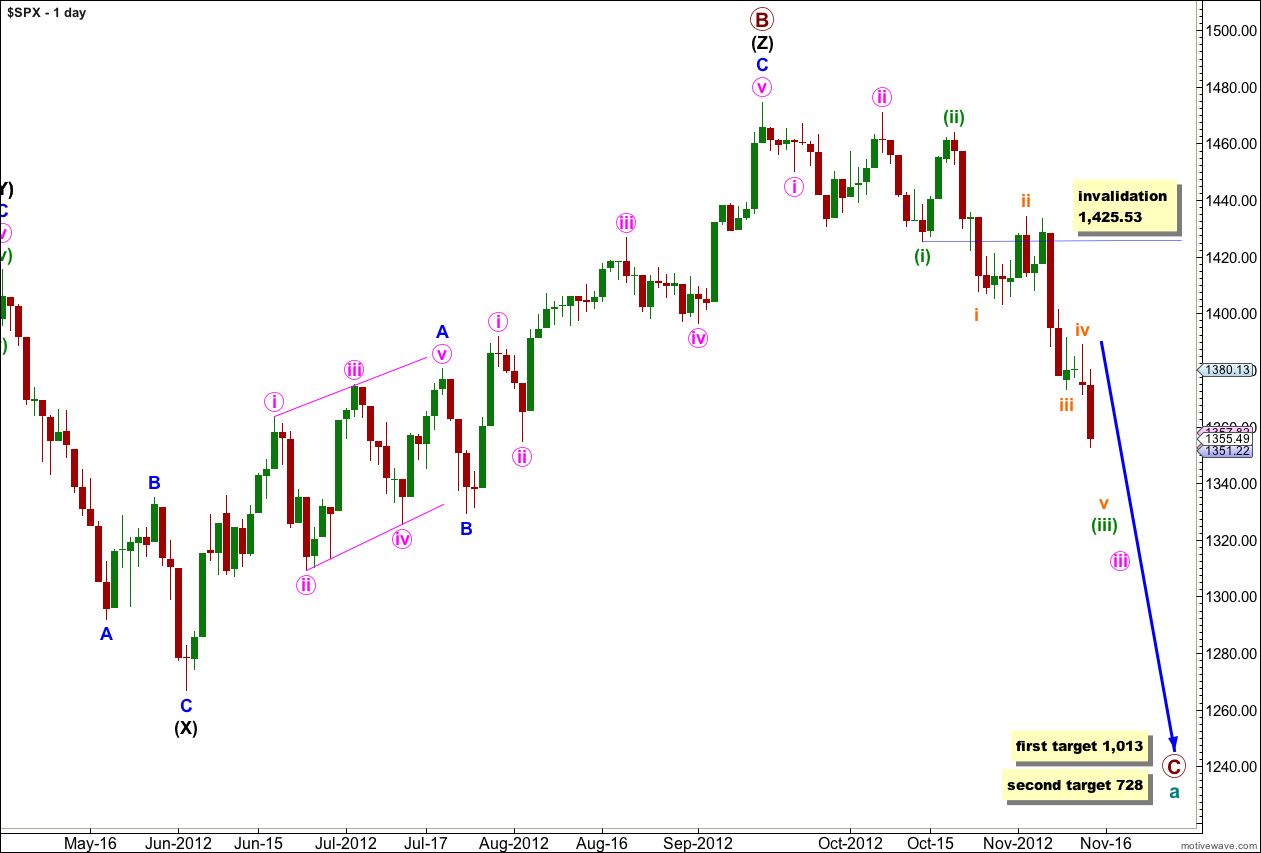
It looks highly likely that we have recently seen a major trend change in the S&P 500 and the DJIA. For both markets this trend change is confirmed.
The upper black line is the upper edge of a parallel channel drawn on the monthly chart. This area may have provided resistance.
The channel drawn about the zigzag of wave (Z) black using Elliott’s technique for a correction is very clearly breached. This is some indication that this wave count may be correct.
Within the new downwards trend the upcoming wave (iv) green may not move into wave (i) green price territory. This wave count is invalidated at this stage with movement above 1,425.53.
Downwards movement looks most likely to be a series of overlapping first and second waves, with the middle of the third wave complete. We shall expect overall downwards movement with fourth wave corrections to come.
Cycle wave a is an expanded flat correction: primary wave A was a three wave structure, and primary wave B was a triple zigzag and 140% the length of primary wave A.
At 1,013 primary wave C would reach 1.618 the length of primary wave A. If price continues downwards through this first target then the next target is at 728 where primary wave C would reach 2.618 the length of primary wave A.
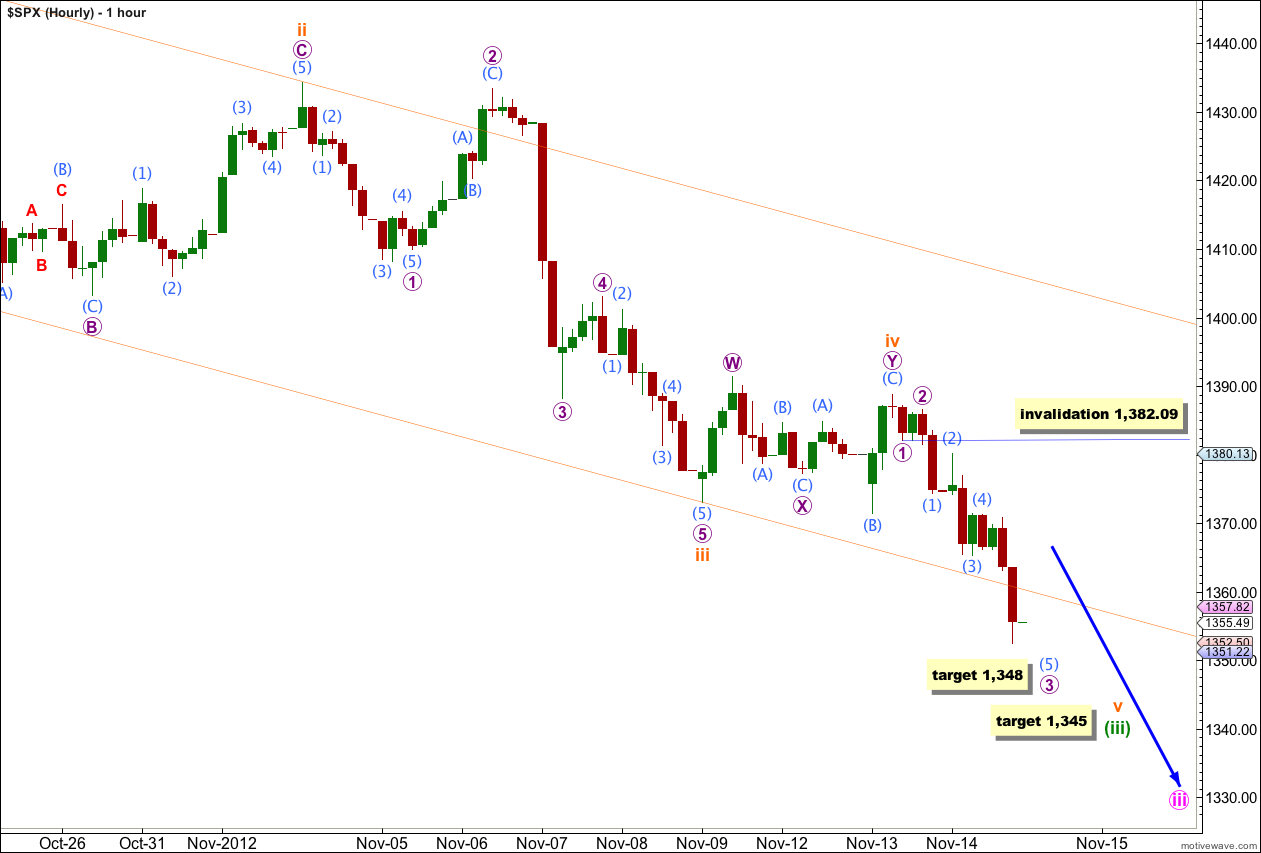
Today I have just the one wave count on the hourly chart for you.
Wave iv orange did not move higher as expected. It was over already as a double combination which exhibited traits of a running flat in that wave Y purple did not make a new high beyond the end of wave W purple. However, the structure may be considered complete and meets all rules and guidelines for a combination, mostly that it move price sideways.
Wave iii orange is 4.78 points longer than equality with wave i orange. This means it is less likely that wave v orange will exhibit a Fibonacci ratio to either of i or iii.
At 1,345 wave (iii) green would reach 2.618 the length of wave (i) green. I cannot find a price point close to this for a target calculation at orange degree so I will use this target alone as more likely.
In the short term tomorrow this structure appears to require more downwards movement for wave (5) aqua within wave 3 purple. I would expect more downwards movement tomorrow at least to a short term target at 1,348 where wave (5) aqua would reach 1.618 the length of wave (3) aqua.
When wave 3 purple is complete we should see a brief movement for wave 4 purple which may not move into wave 1 purple price territory. This wave count is invalidated with movement above 1,382.09. Wave 2 purple lasted 2 hours so I would expect wave 4 purple to be over within a session.