
Price moved sideways during Monday in a very quiet session. The wave counts are unchanged. This sideways movement looks like a fourth wave correction.
I have still just the one daily wave count with two hourly wave counts looking at most recent movement differently. The expectations for the next direction is the same, only the invalidation points differ at this stage.
Click on the charts below to enlarge.
It looks highly likely that we have recently seen a major trend change in the S&P 500 and the DJIA. For both markets this trend change is confirmed.
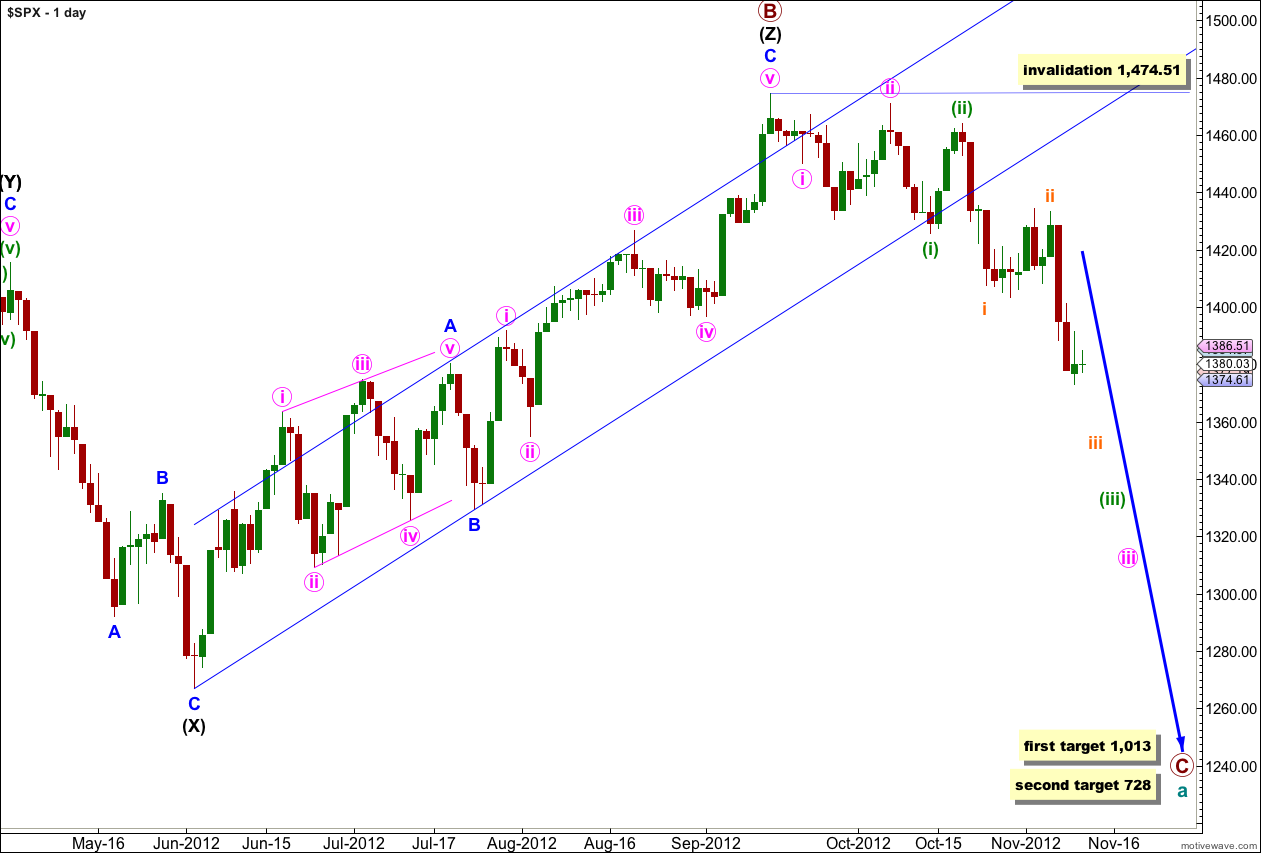
The upper black line is the upper edge of a parallel channel drawn on the monthly chart. This area may have provided resistance.
The channel drawn about the zigzag of wave (Z) black using Elliott’s technique for a correction is very clearly breached. This is some indication that this wave count may be correct.
Within the new downwards trend no second wave correction may move beyond the start of the first wave. This wave count is invalidated with any movement above 1,474.51.
Downwards movement looks most likely to be a series of overlapping first and second waves.
Cycle wave a is an expanded flat correction: primary wave A was a three wave structure, and primary wave B was a triple zigzag and 140% the length of primary wave A.
At 1,013 primary wave C would reach 1.618 the length of primary wave A. If price continues downwards through this first target then the next target is at 728 where primary wave C would reach 2.618 the length of primary wave A.
Main Hourly Wave Count.
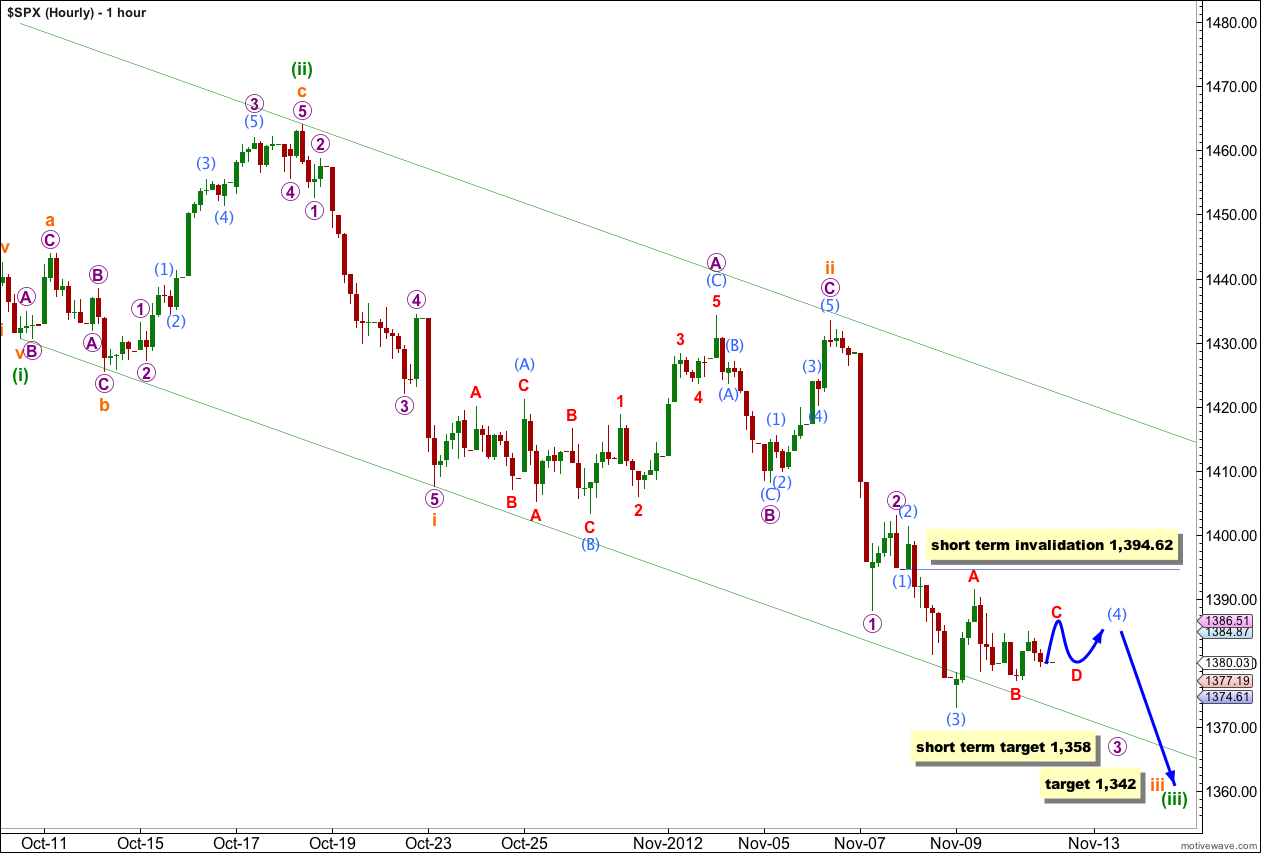
Analysis at the hourly chart level is barely changed from Friday. Sideways movement may be an unfolding triangle for a fourth wave. For this main wave count the triangle would be wave (4) aqua, which would be out of proportion to its counterpart wave (2) aqua which decreases the probability of this wave count slightly.
Within the triangle waves A and B red would most likely be complete, with waves C, D and E red to unfold over another one to two sessions.
Wave C red may not move beyond the end of wave A red for a contracting triangle. The triangle is invalidated with movement above 1,391.39. If price does move above this point then wave (4) aqua may be unfolding as a double or a flat.
Wave D red of the triangle may not move much below the end of wave B red at 1,377.19. If the triangle is a barrier triangle then wave D red may end about the same level as wave B red, and may be very slightly below, as long as the B-D trend line is essentially flat.
Wave (4) aqua may not move into wave (1) aqua price territory. This wave count is invalidated with movement above 1,394.62. If this wave count is invalidated with upwards movement then we should use the alternate below.
At 1,358 wave 3 purple would reach equality in length with wave 1 purple. This short term target may be met in another two to four sessions.
At 1,342 wave iii orange would reach 1.618 the length of wave i orange.
After wave (5) aqua completes wave 3 purple, we should expect an upwards correction for wave 4 purple. Wave 4 purple may not move into wave 1 purple price territory. This wave count is invalidated with movement above 1,388.14 at that stage.
I have drawn a best fit parallel channel about this downwards movement of wave (iii) green. I would expect price to move along the lower end of this channel, with an overshoot possible.
Alternate Hourly Wave Count.
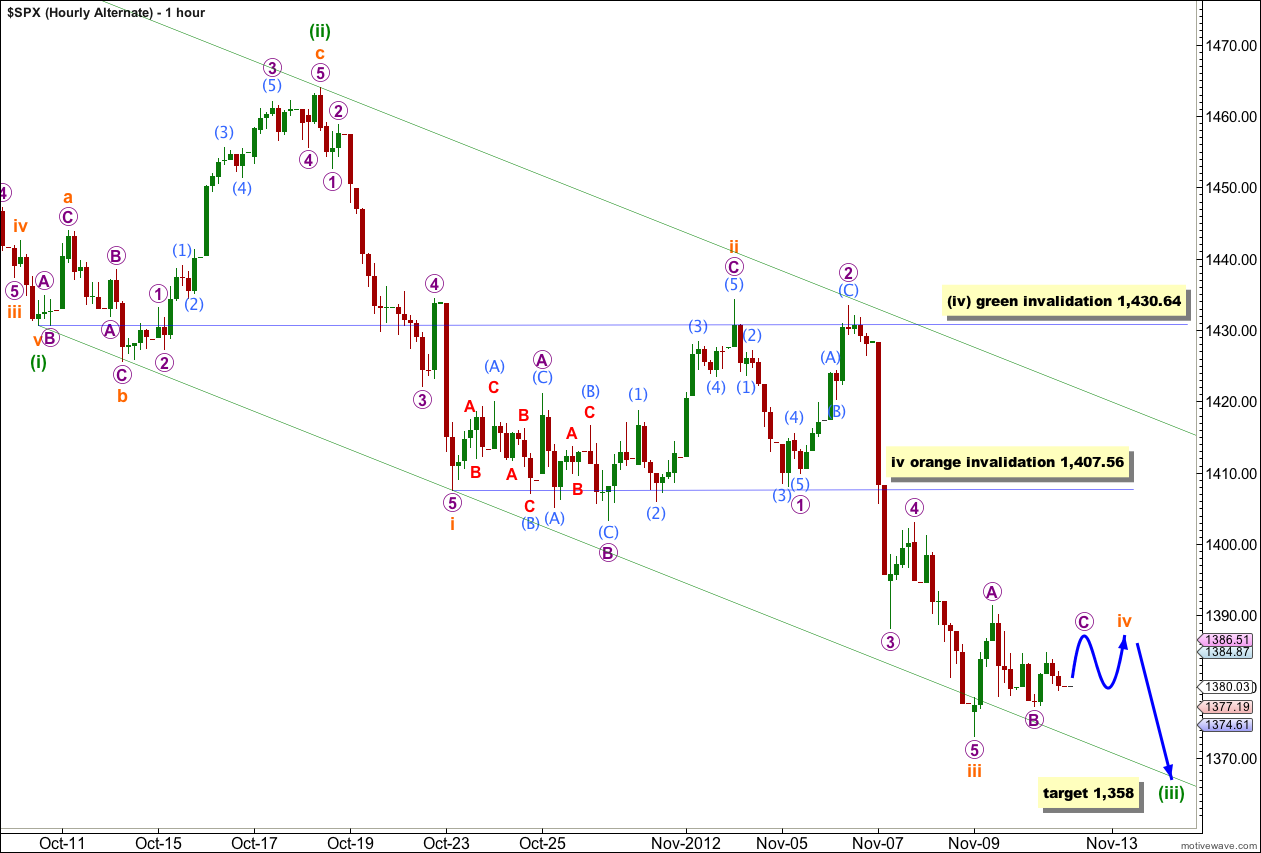
Alternatively, if we see the correction for wave ii orange ending sooner (avoiding a truncated C wave) then wave iii orange may be complete.
This alternate does not agree with MACD. The strongest reading for MACD is for wave 5 purple within wave iii orange, and not for the middle of the third wave, which fits the main hourly wave count best. For this reason I would only use this alternate if the main hourly wave count is invalidated. However, for this alternate waves ii and iv orange may be nicely in proportion. If that is the case then I would swap this alternate with the main hourly wave count as the overall look of the wave count is more important than fitting it with MACD (which should be used as a guideline only and not definitive).
When wave v orange is complete then we should expect a longer lasting correction for wave (iv) green. Wave (ii) green was a deep 83% correction of wave (i) green and was an expanded flat structure. I would expect wave (iv) green to be a shallow correction and either a zigzag or more likely a double. Wave (iv) green may not move into wave (i) green price territory. This wave count is invalidated at that stage with movement above 1,430.64.
I would expect wave (iv) green to find resistance at the upper edge of this channel.