
Last analysis expected downwards movement for Friday’s session. The S&P 500 made a new low as price moved lower, before turning upwards for a small correction.
At this stage we have clarity. I have just one wave count at the daily chart level, with two hourly charts looking at most recent movement differently.
Click on the charts below to enlarge.
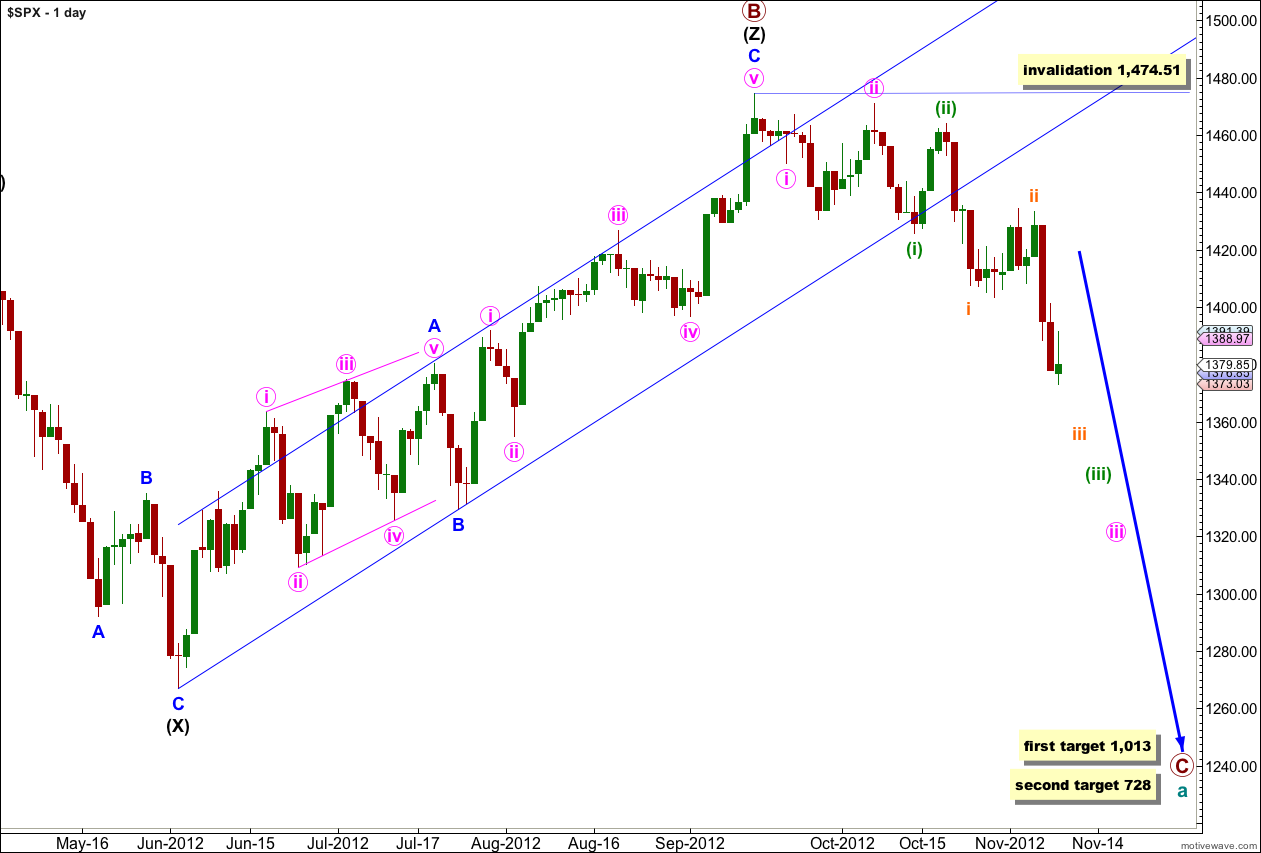
It looks highly likely that we have recently seen a major trend change in the S&P 500 and the DJIA. For both markets this trend change is confirmed.
The upper black line is the upper edge of a parallel channel drawn on the monthly chart. This area may have provided resistance.
The channel drawn about the zigzag of wave (Z) black using Elliott’s technique for a correction is very clearly breached. This is some indication that this wave count may be correct.
Within the new downwards trend no second wave correction may move beyond the start of the first wave. This wave count is invalidated with any movement above 1,474.51.
Downwards movement looks most likely to be a series of overlapping first and second waves.
Cycle wave a is an expanded flat correction: primary wave A was a three wave structure, and primary wave B was a triple zigzag and 140% the length of primary wave A.
At 1,013 primary wave C would reach 1.618 the length of primary wave A. If price continues downwards through this first target then the next target is at 728 where primary wave C would reach 2.618 the length of primary wave A.
Main Hourly Wave Count.
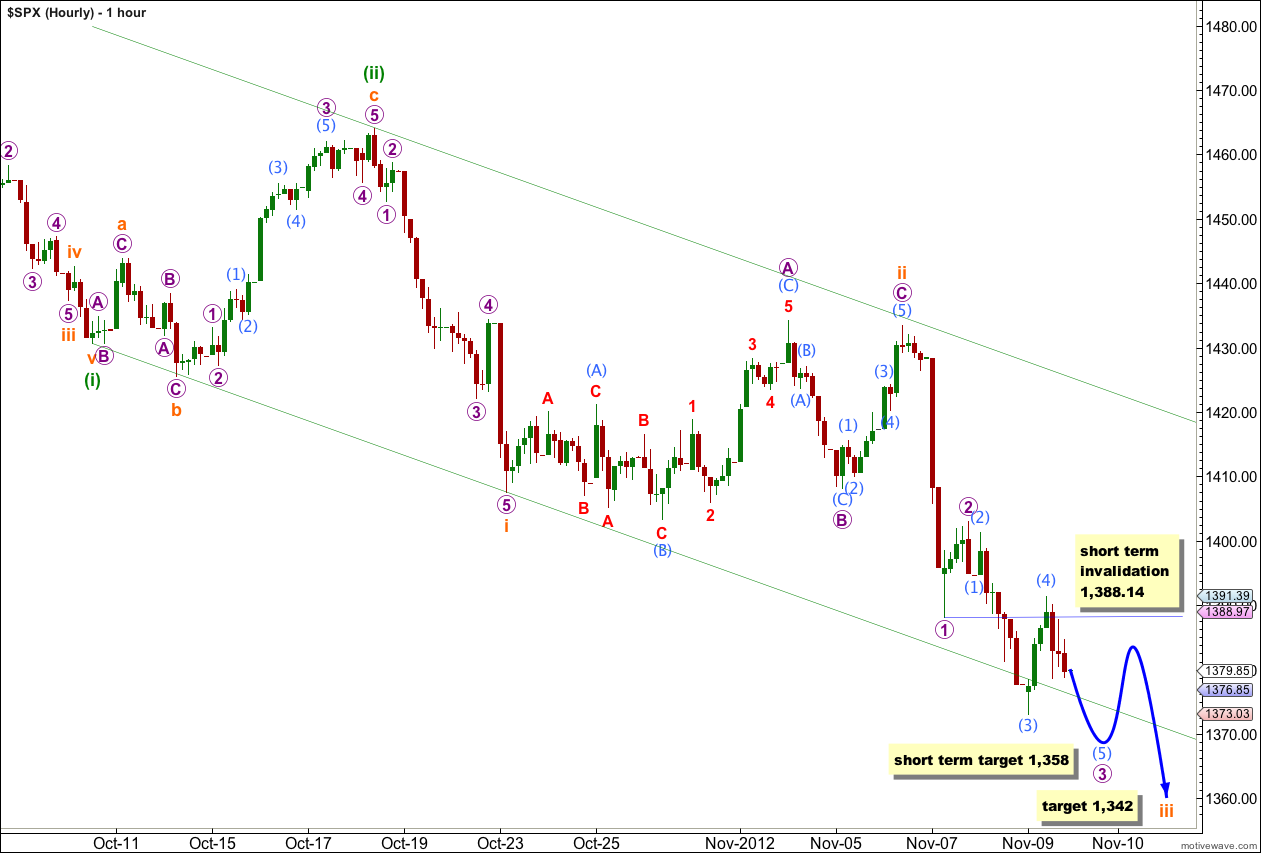
This main hourly wave count is the same as last analysis except that I have moved everything up one degree.
Downwards movement to begin Friday’s session looks like an end to the middle of the third wave, wave 3 red. Upwards movement looks like wave 4 red which was expected.
There is no Fibonacci ratio between waves (3) and (1) aqua.
At 1,358 wave 3 purple would reach equality in length with wave 1 purple. This short term target may be met during Monday or Tuesday’s sessions.
At 1,342 wave iii orange would reach 1.618 the length of wave i orange.
In the short term, after wave (5) aqua completes wave 3 purple, we should expect an upwards correction for wave 4 purple. Wave 4 purple may not move into wave 1 purple price territory. This wave count is invalidated with movement above 1,388.14.
I have drawn a best fit parallel channel about this downwards movement of wave (iii) green. I would expect price to move along the lower end of this channel, with an overshoot possible.
Alternate Hourly Wave Count.
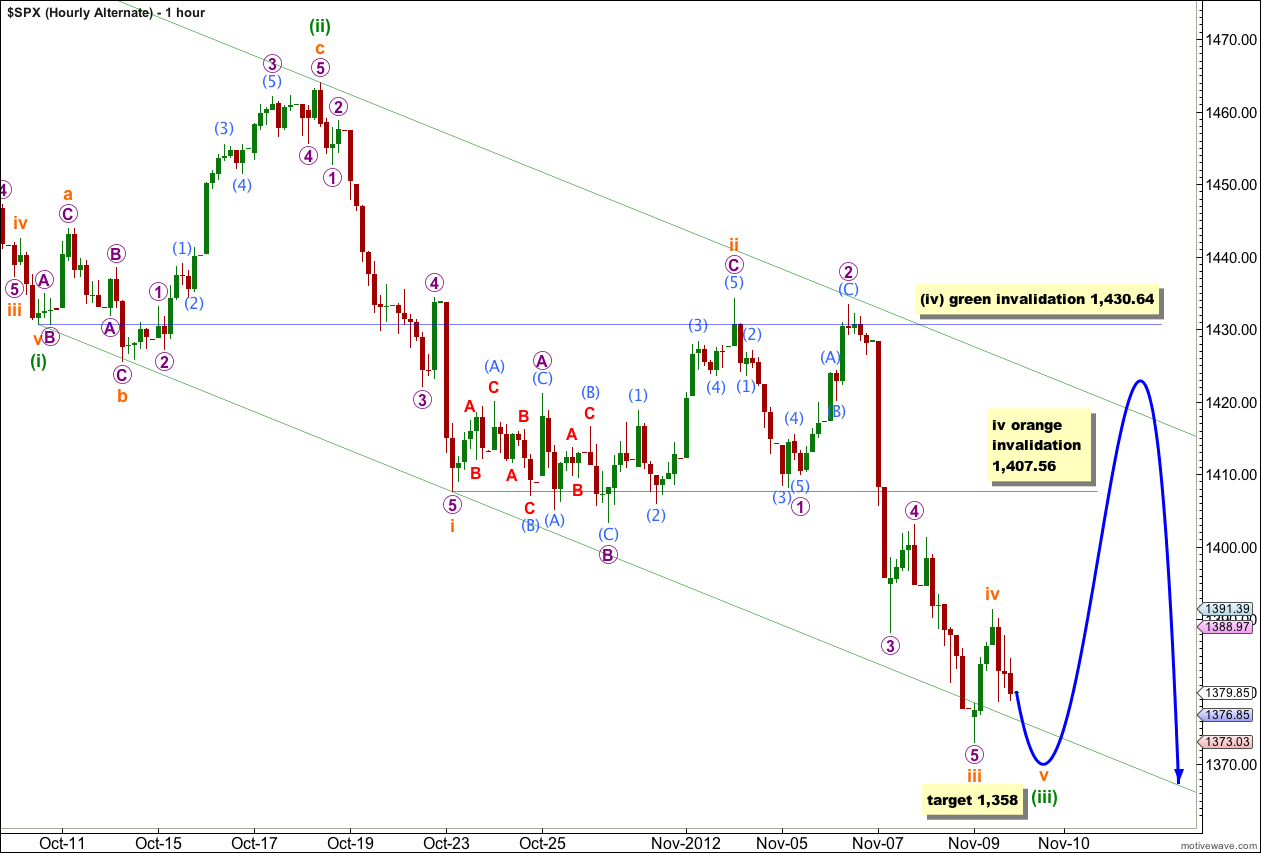
Alternatively, if we see the correction for wave ii orange ending sooner (avoiding a truncated C wave) then wave iii orange may be complete.
This alternate does not agree with MACD; the strongest reading for MACD is for wave 5 purple within wave iii orange, and not for the middle of the third wave, which fits the main hourly wave count best. For this reason I would only use this alternate if the main hourly wave count is invalidated.
Wave iii orange is 4.78 points longer than equality with wave i orange.
Ratios within wave iii orange are: wave 3 purple has no Fibonacci ratio to wave 1 purple, and wave 5 purple is just 2.04 points longer than 0.618 the length of wave 3 purple.
Waves ii and iv orange are here out of proportion. This does not invalidate the wave count but it does reduce the probability further as it looks odd. However, wave iv orange may not be over and may continue further sideways and higher as a flat or double. If it does this it may not move into wave i orange price territory. This wave count is invalidated in the short term with movement above 1,407.56.
When wave v orange is complete then we should expect a longer lasting correction for wave (iv) green. Wave (ii) green was a deep 83% correction of wave (i) green and was an expanded flat structure. I would expect wave (iv) green to be a shallow correction and either a zigzag or more likely a double. Wave (iv) green may not move into wave (i) green price territory. This wave count is invalidated at that stage with movement above 1,430.64.
I would expect wave (iv) green to find resistance at the upper edge of this channel.