
Exactly as expected from yesterday’s analysis price has moved lower during Thursday’s session.
We have movement below the confirmation point of the main wave count and the alternate is now invalidated. We have only one wave count and we may have a lot of confidence in it now.
Click on the charts below to enlarge.
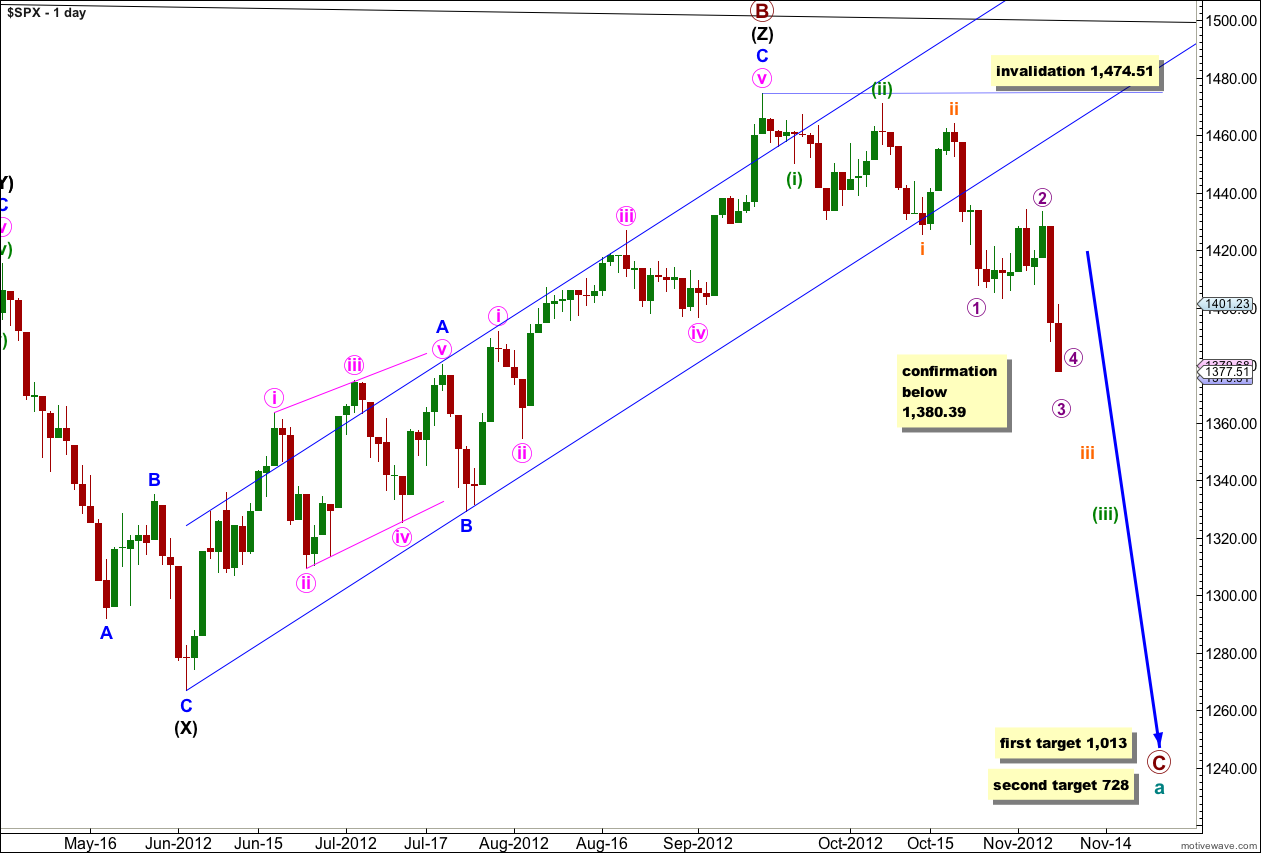
It looks highly likely that we have recently seen a major trend change in the S&P 500 and the DJIA. For both markets this trend change is confirmed.
The upper black line is the upper edge of a parallel channel drawn on the monthly chart. This area may have provided resistance.
The channel drawn about the zigzag of wave (Z) black using Elliott’s technique for a correction is very clearly breached. This is some indication that this wave count may be correct.
Within the new downwards trend no second wave correction may move beyond the start of the first wave. This wave count is invalidated with any movement above 1,474.51.
Downwards movement looks most likely to be a series of overlapping first and second waves.
Cycle wave a is an expanded flat correction: primary wave A was a three wave structure, and primary wave B was a triple zigzag and 140% the length of primary wave A.
At 1,013 primary wave C would reach 1.618 the length of primary wave A. If price continues downwards through this first target then the next target is at 728 where primary wave C would reach 2.618 the length of primary wave A.
Main Hourly Wave Count.
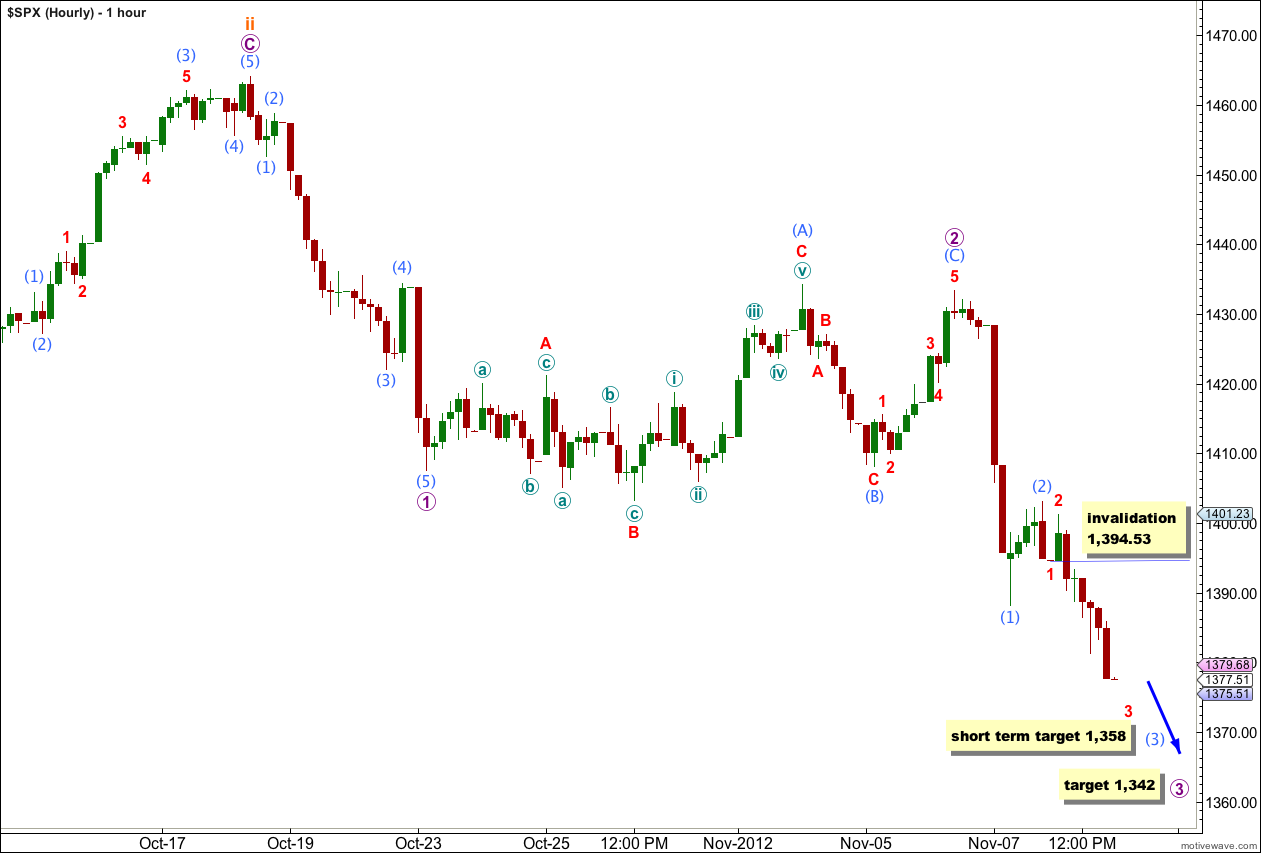
This wave count is the same as yesterday.
Within downwards movement we may be extremely close to the middle of a third wave. Wave (1) aqua looks like a typical first wave as they often start off with a sharp drop. MACD indicates that despite a shallower slope for Thursday’s session momentum has increased, which fits this wave count seeing Thursday’s session as moving towards the middle of a third wave.
At 1,342 wave 3 purple would reach 1.618 the length of wave 1 purple.
At 1,358 wave (3) aqua would reach 1.618 the length of wave (1) aqua. This short term target may be reached tomorrow.
Within wave (3) aqua wave 4 red may not move into wave 1 red price territory. This wave count is invalidated in the short term with movement above 1,394.53.
If this hourly wave count is invalidated tomorrow or the session after then we may use the alternate below.
Hourly Alternate Wave Count.
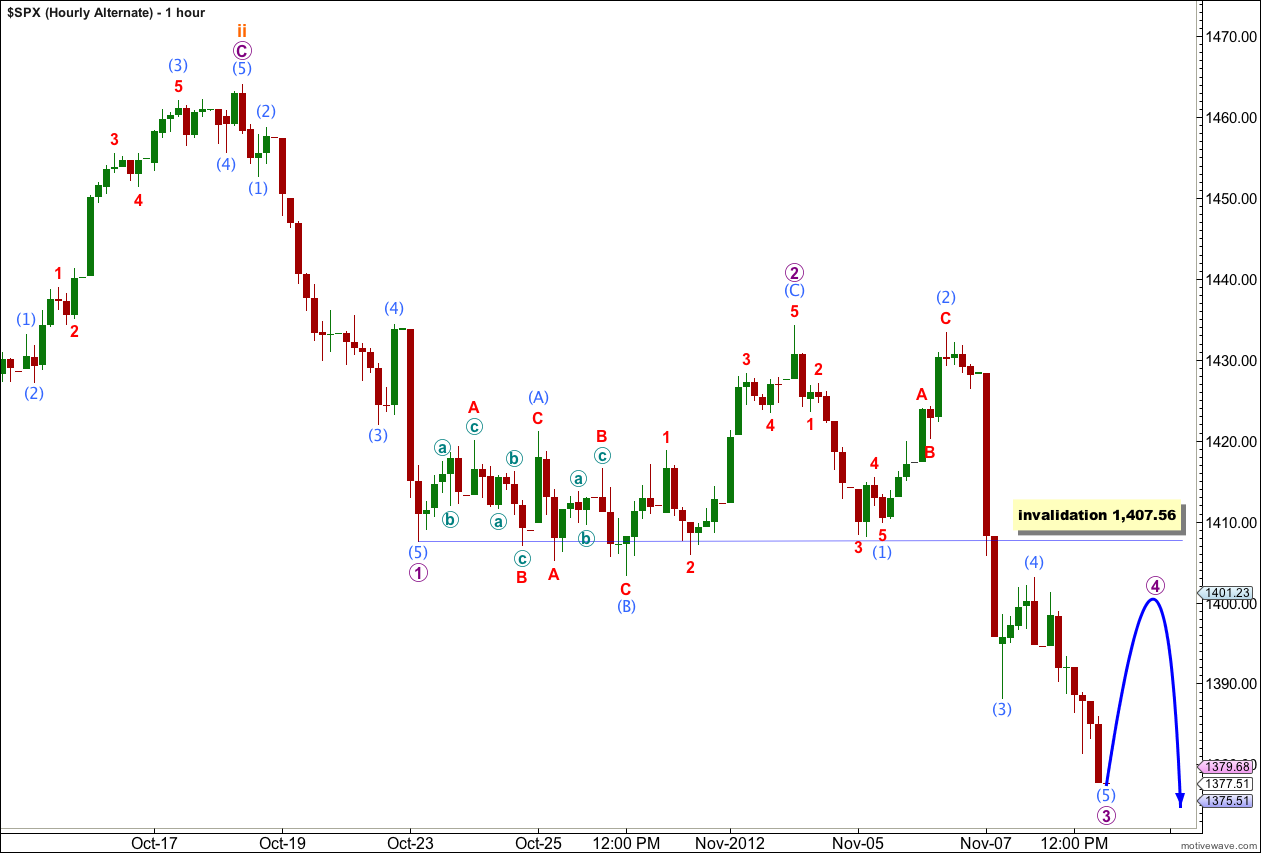
If wave 2 purple ended as labeled here then the following downwards movement may have been waves (1) and (2) aqua within wave 3 purple.
This alternate sees the possibility that we have just passed the middle of the third wave.
Wave 3 purple is just 0.3 points longer than equality with wave 1 purple.
Ratios within wave 3 purple are: wave (3) aqua has no Fibonacci ratio to wave (1) aqua, and wave (5) aqua is just 1.17 points longer than equality in length with wave (1) aqua.
This wave count expects higher slowly moving sideways movement for wave 4 purple. Wave 4 purple may not move into wave 1 purple price territory. This hourly wave count is invalidated with movement above 1,407.56.
This wave count does not fit MACD as well as the first hourly wave count, so we should only use it as an alternate if the main hourly wave count is invalidated.